
Intersect’s Board Elections 2025 Voting window will close today on Friday, September 26th at 12:00 UTC. The organization reminded members of cutoffs and linked step-by-step instructions for casting votes. Voting will determine four of the seven board seats.
Additionally, Intersect’s recent development update has flagged open votes along with the release of new Govtool versions. This post directed members to live resources used during the election period. It emphasized clarity and participation in the process.
Finally, Intersect’s election hub outlines the September board of directors contest within a broader governance season. The committee election continues in October, maintaining the integrity of community decision-making. Materials summarise range, timing and role.
Cardano Day begins today in Laramie, Wyoming and runs until Saturday, September 27th. The University of Wyoming events page lists practical sessions on Cardano fundamentals, smart contracts and governance. Registration is available on both days.
Additionally, the input and output were date checked and the program was described as a two-day in-person learning experience. This memo emphasized its focus on practical education across key topics.

The event is located within the Wyoming Blockchain Stampede Schedule, hosted by the university. Stampede materials provide details of the wider festival windows and campus venues, while external listings provide a snapshot of the location and agenda.
Cardano on Friday, September 26th, 2025: Bullish flag in focus
Daily setup and date context
Cardano’s Daily ADA/USDT Chart on Friday, September 26th, 2025 shows prices close to $0.772. The move comes after weeks of pullbacks within the downward channel drawn from the highs in early September. Volume remains medium compared to August spikes.
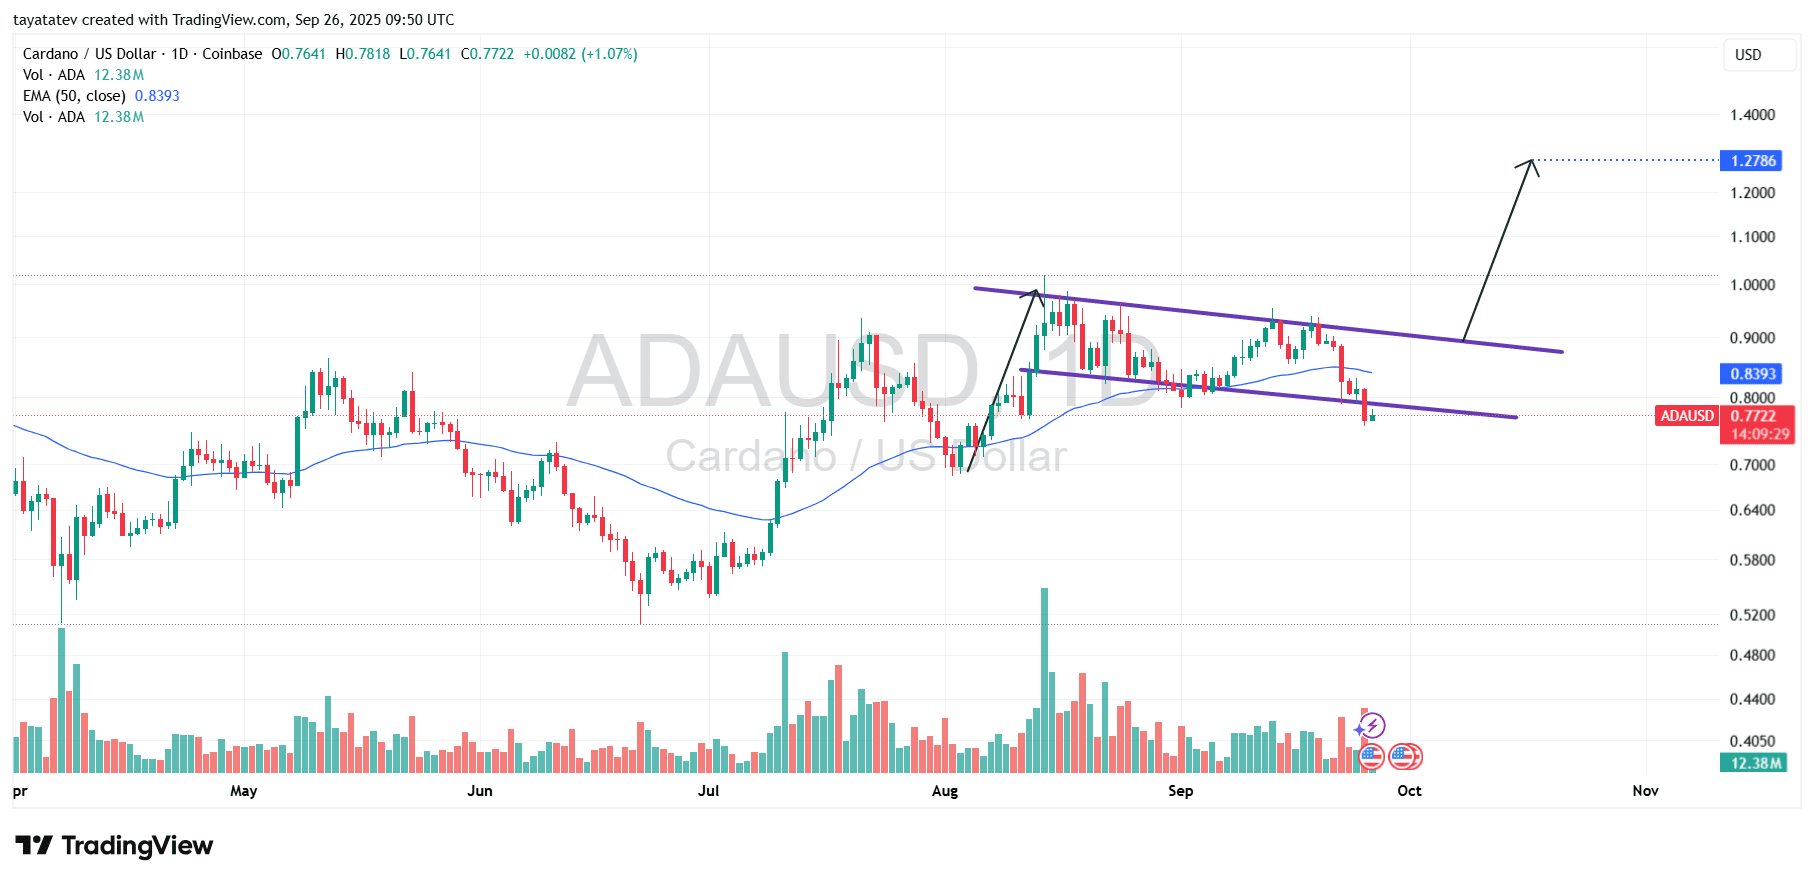
Additionally, the 50-day Exponential Moving Average (EMA) is near and above $0.839. That level, along with a round $0.80 area, forms the first band recovered for momentum. The channel limit is slightly tracking $0.90, marking the next structural hurdle:
Taken together, the layout assembles the integration after the profits from July to August. It also sets the stage of the continuation pattern if the buyer recovers the midline of the channel and 50 days of EMA with a conviction.
The structure and behavior of a bullish flag
The chart outlines the classic bullish flag. A sharp advance forms a “flag pole,” followed by a controlled drift on the bottom inside the parallel line. The channel gradient is shallower than previous rises that fit the textbook profile.
But today’s candles show that prices are leaking slightly below the flag’s lower guide. This type of short undercut is common during the second half of the pattern, especially when the volume does not expand actively during breaks. If the price rotates quickly within the rail, it will not override the structure.
Therefore, look at the quick return above the lower boundary, then press the midline. Over $0.80 each day, followed by around $0.839 traction on a 50-day EMA, suggesting that the pattern has resumed constructive behavior.
Measured movement and 65% target
The flag’s target usually reflects a portion of the flagpole height projected from the breakout zone. Using today’s spot prices as a work base, a 65% advance means a destination of nearly $1.27. Precisely calculated, 65% above $0.772 is around $1.274, consistent with the technical objectives depicted on the chart.
In fact, channel retrieval and break into the $0.90 area open the measured band room. Subsequent verification comes from higher prices and support volumes as prices approach the $1 handle.
Until then, there is a risk pivot near the recent lows just below the lower rail. Reclaiming the $0.80 area, then 50 days of EMA, keep the bullish flag paper intact and save the path to the $1.27 zone.
Cardano’s Daily RSI (14) reads 37.04 today, below the neutral 50 line and below the RSI average of nearly 49.70. This arrangement shows weak momentum rather than yielding, as the gauge is still above 30. In news terms, pressure persists, but conditions do not reach the classic sold.
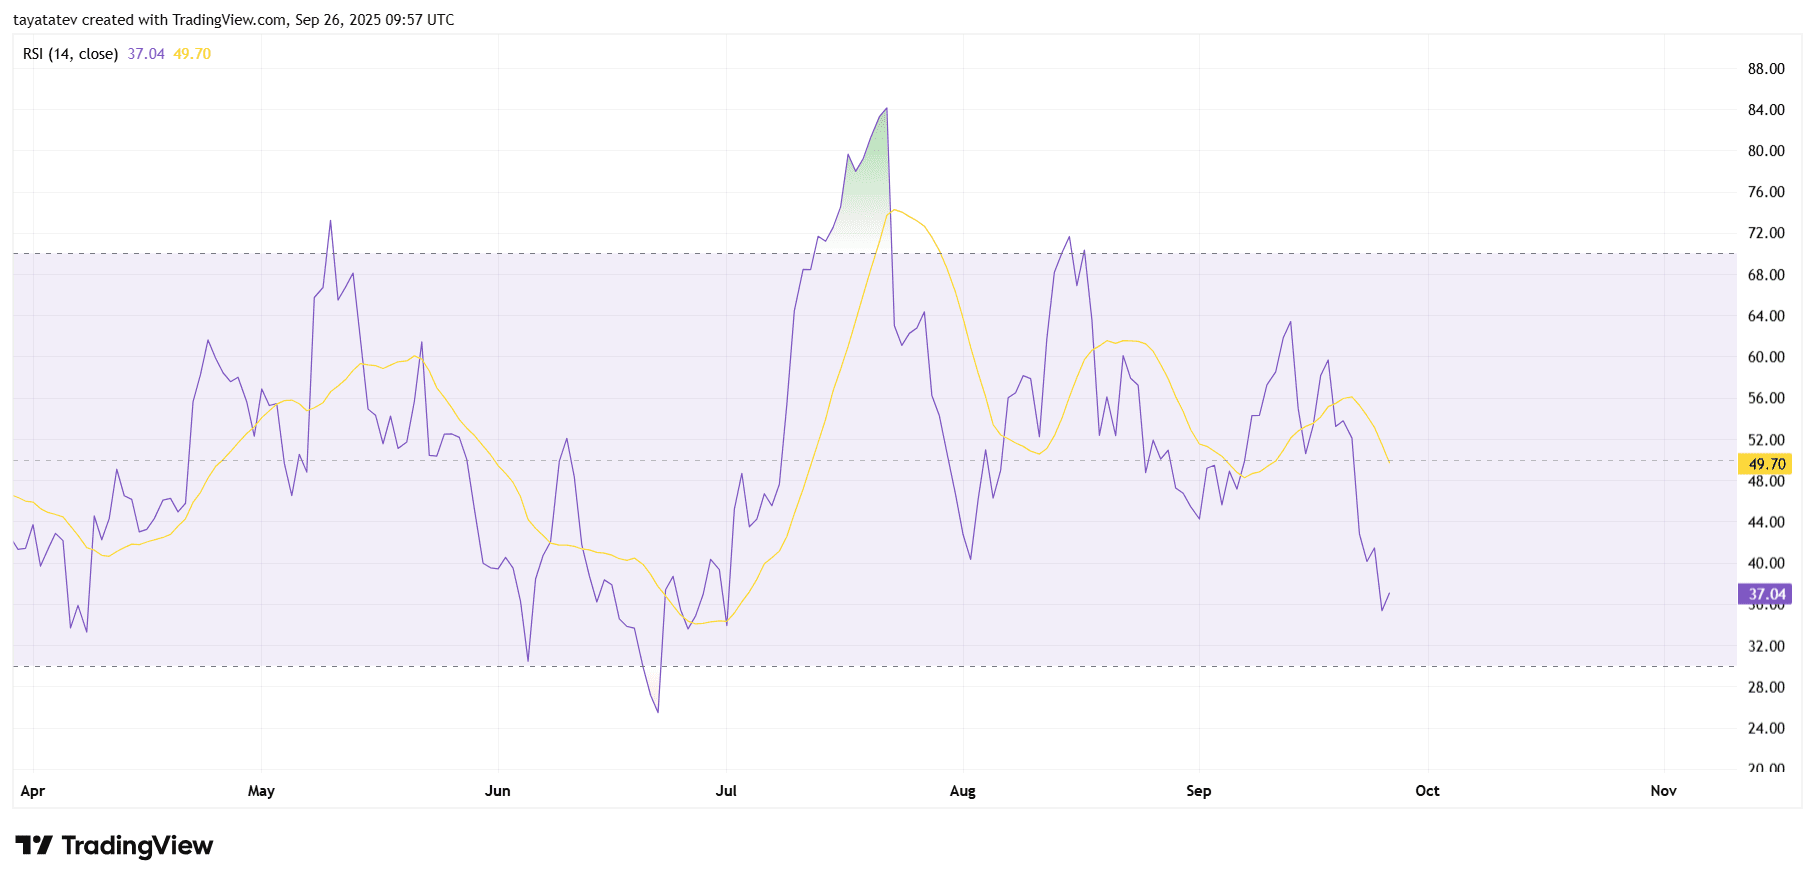
Explained now. RSI measures how fast or loses price increases over the past 14 sessions. Values below 50 allow the seller to control the short-term pace. Values near 30 often mark fatigue. The Bears are leading because RSI sits in their 30s, but they don’t force a washout. The gap between RSI (37.04) and its average (approximately 49.70) indicates a delayed momentum. Therefore, the gathering may disappear until the purple line exceeds the yellow average.
Next is the context. In July, RSI pushed over 70 as prices skyrocketed, rolling through August and September. That sequence created a low RSI high that coincides with the integration of the price chart. Reading today continues its drift. However, the downswing these days has started to slow down. This is considered a smaller RSI bar and a gentle slope. If the RSI first appears through 40-45, it indicates that the seller is losing pace before the breakout attempt.
Finally, what should we look at? Climb above the RSI average, then climbing past 50 to the past 50, often along a constructive shift, leading to a price-up follow-through. Conversely, a clean break below 30 marks stress and usually causes only short reflexes unless the RSI recovers the 30s immediately. Price increases will remain in the face of higher bars until momentum is repaired.
Cardano MACD on Friday, September 26th, 2025
Cardano’s daily MACD (12, 26, 9) is registered under the zero line, with both the MACD and the signal line being around a negative 0.016. This arrangement checks the bearish momentum in the daily time frame. Additionally, the histogram prints a red bar below zero. This shows the construction of the lower pressure after recent bullish attempts have stopped.
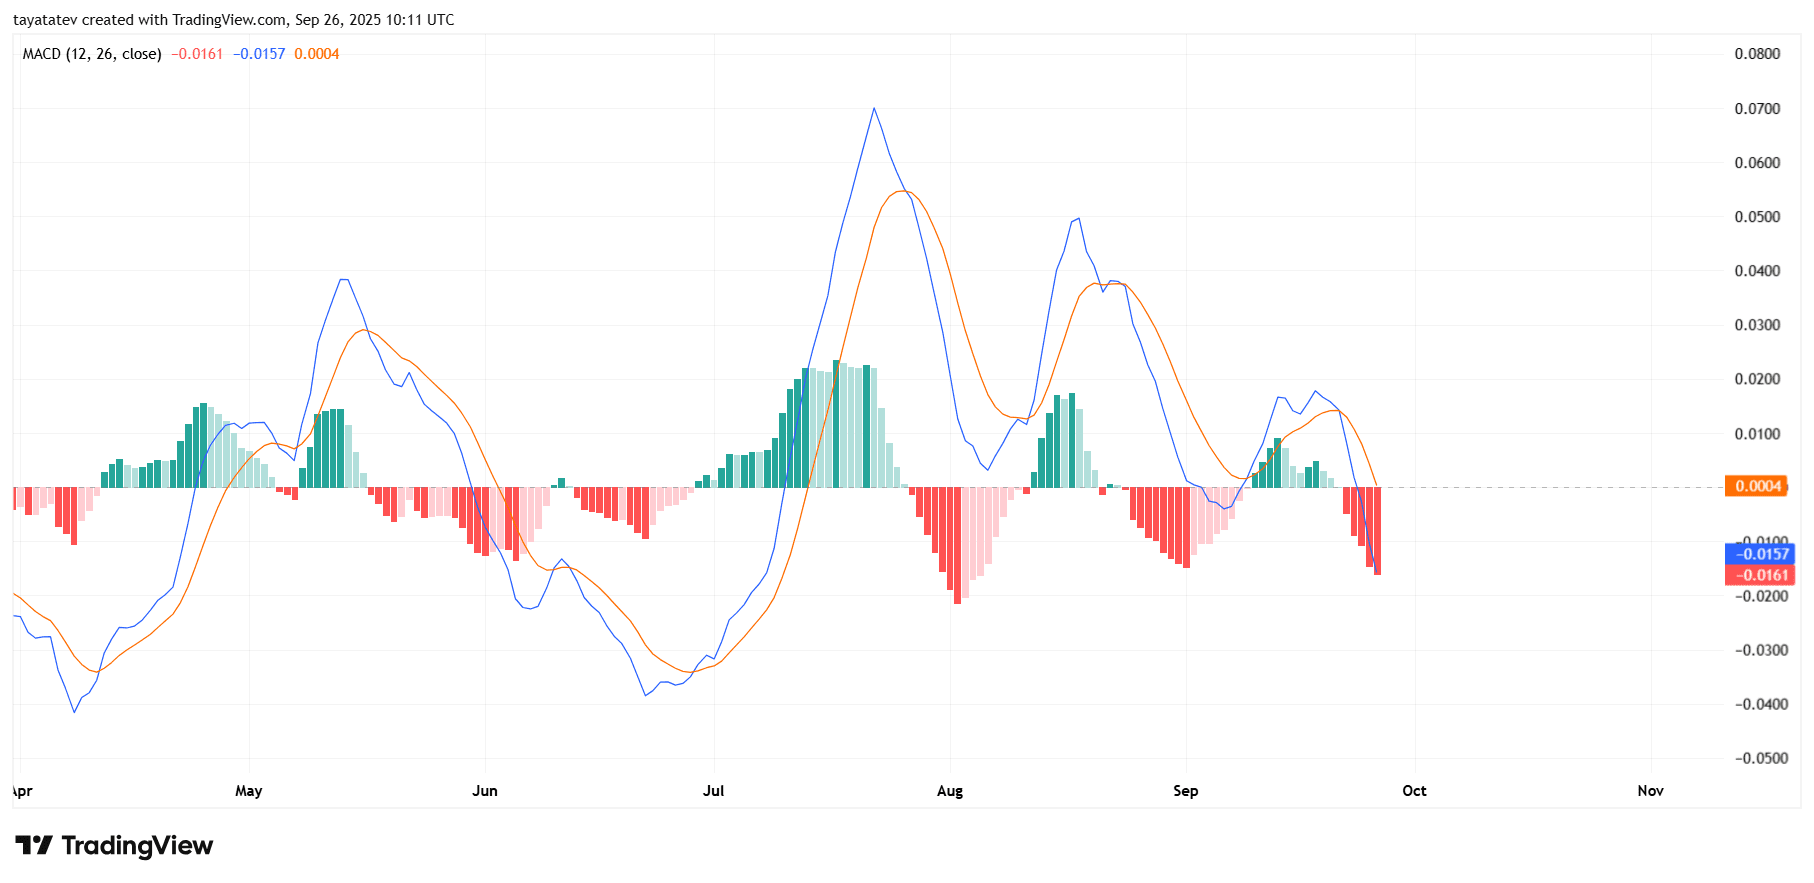
However, the gap between the MACD and the signal line remains narrow. When that spread is compressed near the zero axis, the market often prepares for momentum inflection. Therefore, if the histogram starts to rise towards zero and invert to light green, it indicates that sales power is declining before price recovery.
Until then, current alignments support defensive conditions. The daily intersection of MACD back on top of the signal line may match the price, which constructively shifts the tone and plays the moving average near the main chart, following the climb through the zero line. Without that sequence, the assembly could fade as the negative histogram persists.