
Synthetix will extend Infinex’s SUSD deposit rewards until November 7, 2025, keeping the incentive live as teams push mainnet derivatives. This update landed today with a clear timeline and unchanged eligibility rules. The current campaign continues to run for the next six weeks.
The official X post repeated core details, pointing out users to weekly OP distributions and raffle awards on the chain tied to qualifying SUSD balances. The message was followed by the guidance on the blog to confirm the new end date.
As Synthetix focuses liquidity and product activity on Ethereum Mainnet, extensions arrive. As a result, the rewards program remains a bridge between today’s deposit flow and future PERPS rollouts.
What includes rewards
According to today’s post, eligible depositors share their weekly OP token emissions. Additionally, you will receive on-chain raffle entries that allow you to award items such as Infinex Patron NFTS, ETH, and SNX. The channel emphasized that both mechanisms continue during the expansion window.

The program runs natively in Infinex using rewards and prize logic run on-chain. Its design offers clear cutoffs tied to transparent distribution and campaign dates.
Previous rounds use the same framework, allowing contributors to compare occurrence patterns over several months and track how incentive levels affect deposit behavior. Synthetix uses these iterations to keep parameters predictable during architecture shifts.
Why is it important now?
Synthetix is preparing its first PERPS exchange on the Ethereum Mainnet, with public documents pointing to the launch of the Q4. Extending SUSD rewards makes settlement liquidity available as the product stack moves from testing to production.
The campaign also supports SUSD’s role within the ecosystem after months of PEG-Recovery work and protocol changes. Maintaining deposit stickiness provides a smoother handoff to a liquidity program focused on the mainnet.
In short, today’s change will maintain momentum. Maintains user incentives along Synthetix’s short-term roadmap and provides a clear schedule for depositors without changing how they participate until November 7th.
Analysts flag SNXUSDT breakout structure
According to independent analysts, SNX has broken beyond the ceiling for months and may be setting up a continuous movement. Shared DailyysNx/USDT chart shows prices clearing the horizontal resistance band that closes the rally through spring and summer. The boxed zone marks the previous supply area. This now serves as your first support after a breakout.
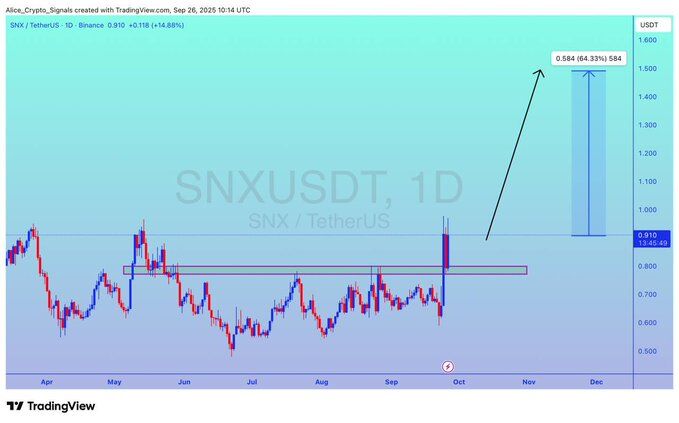
The visual outlines a clean retest scenario. The candle pushed the band and pulled back into the same zone, suggesting a new check of support before momentum resumed. The arrows project a follow-through towards the measured area highlighted on the right side of the chart. The annotations cite approximately 60% potential movement from retest to the target area.
Context is important for this reading. This structure compresses the range trades for several months into one breakout and retest sequence in a daily time frame. Therefore, the paper relies on the regenerative bands holding closed bases. If so, the pattern means continuation. If it fails, the breakout will lose confirmation. The Post frames the setup as a “bulwark wave” preparation, but the chart itself locks the claims with a break retest extension model rather than Info-In Day volatility.
Analyst Map Cup Base and SNX EMA Cross
This chart shows the nine-month “cup” structure that arcs from winter to late September. The price is now near the lips of that base, where previous rally failed with 0.98-1.08 bands. The drawing then projects a breakout, a short pullback to the lips, and an extension towards the 2.03-2.30 zone. This is marked at about +120% from the base.
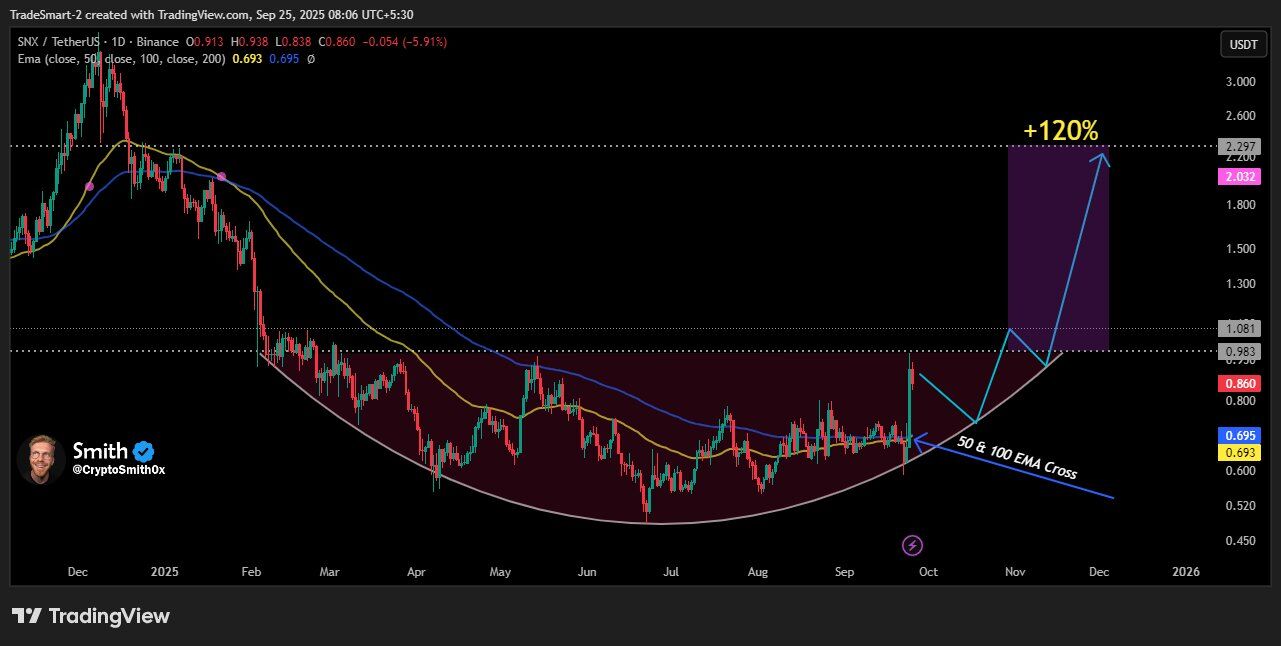
Moving averages enhance bullish readings. The overlay highlights the bullish cross of the 50/100 EMA as prices push through the base neckline. In trend systems, the intersection usually indicates that it improves momentum and reduces the reduced tail. Here, they line up with the right rim of the cup, so both the pattern and Emma point to the same inflection.
However, the path displayed depends on hold at the key level. Sketch is hoping to retest the neckline after the breakout. When closed, it stays on top of the band and the cup logic remains intact. When the price loses its neckline and returns to the newly crossed Emma, the setup weakens and the cup finishing is delayed. In short, this diagram is curled upward, tied up the advantage to ensure that it is closed on the lips.
MACD momentum reverses critically positively in SNX
SNX’s MACD provided a powerful bullish sequence. The MACD line (≈0.065) crossed above the signal line (≈0.044) and passed the zero line, and the histogram printed a tall green bar (≈0.021). This stack – bulbish crosses, zero line retrieval, expansion histogram – accelerates upward momentum rather than everyday bounce.
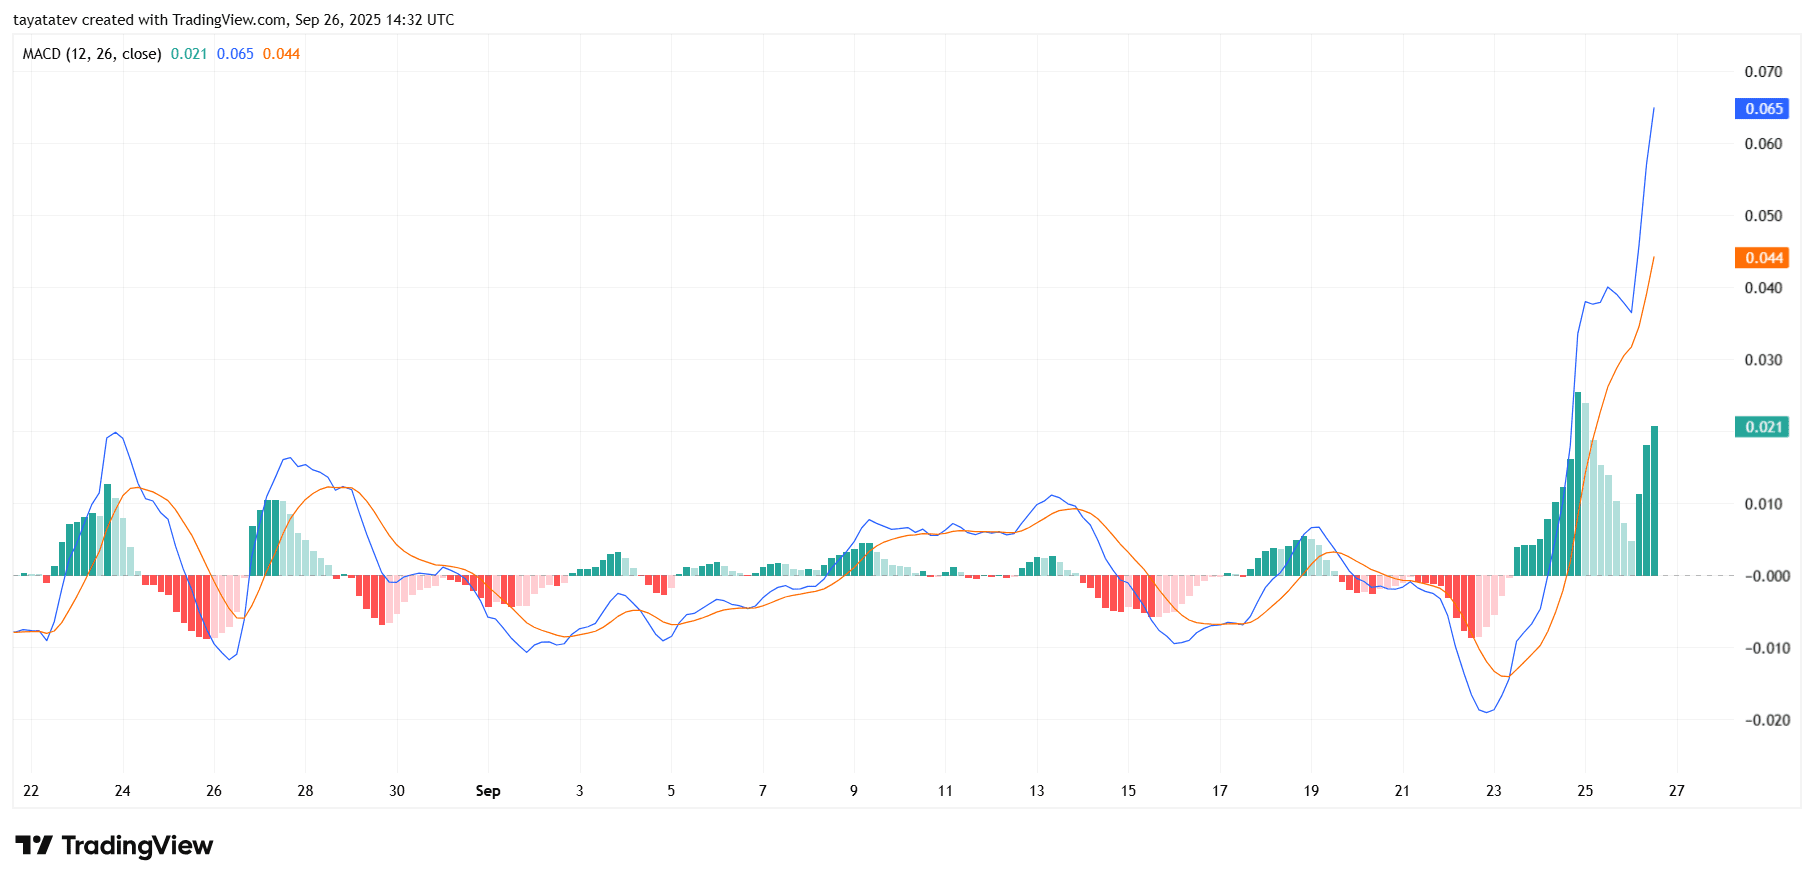
Recent behavior enhances reads. The momentum was negative until September 23rd, with the MACD line turning over as it curved sharply and the signal was delayed. Because MACD is a smoothed scale, such vertical turns usually reflect a wide pickup across multiple candles, not just one spike. The gap between the MACD and the signal line also expands, often maintaining momentum until the signal catches up.
However, the panel shows early signs to monitor. The latest green bar is smaller than the previous peak. This suggests an early slowdown, even if it remains at momentum. The histogram continues and creates a higher or lower value above zero while the lines intersect, retaining the strength of the trend. Once the histogram contracts towards zero and the line converges, the momentum cools and allows for average rotation. In short, the Bulls are controlling the tape for now, but follow-through requires persistent positive histogram printing and a maintained MACD oversignal posture.