
Ethena price has fallen nearly 40% over the past two weeks and looks headed for further losses as it approaches a bearish “death cross” pattern.
summary
- Ethena’s price has fallen 20% in the past week.
- Token unlocking and whale sales in November mainly led to losses.
- A bearish “death cross” is taking shape on the daily chart.
Etena (ENA) has fallen 20% in the past seven days and is down almost 100% from its September highs, according to data from crypto.news. The last check price was trading at $0.31 on Friday afternoon, Asian time, and the altcoin’s market cap has fallen from $3.7 billion to $2.3 billion at the time of writing.
Etena price rebounded slightly on November 6th after Robinhood, a popular US-based trading platform, announced the listing of the token. However, it quickly returned to a downtrend as the unlocking of 171.88 million tokens worth around $54.88 million the previous day continued to pressure the price. Notably, this unlocking event comes just after another $15.7 million was unlocked on November 2nd.
Such token unlocking tends to add more tokens into circulation, reducing scarcity and putting pressure on prices, especially when overall market activity is subdued.
After the latest unlocks, there are currently 7.42 billion tokens in circulation, with approximately 70% of this supply still in the hands of early investors and Ethena team members. Therefore, investors are likely to remain cautious about the possibility of taking profits.
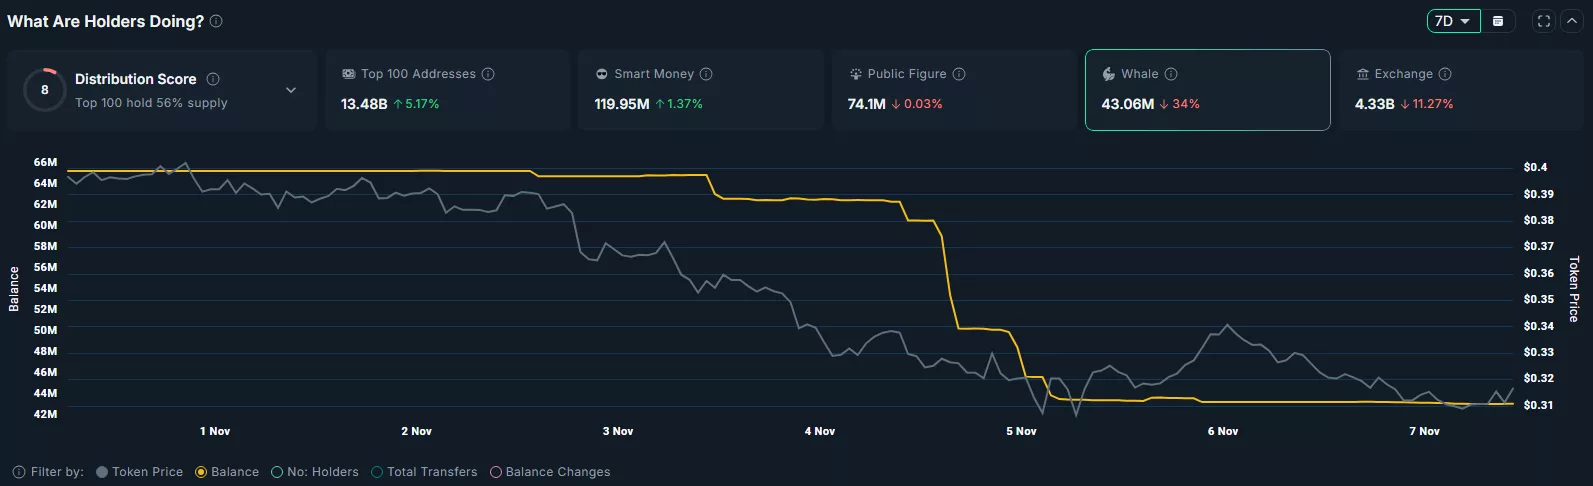
At the same time, Nansen’s data suggest that whales also played a large role in Etena’s downturn. The total balance of tokens held by whale addresses has decreased from 65.24 million on October 31st to 43.06 million at the time of writing. Whale sales often cause panic among retail traders, who tend to follow suit, amplifying downward pressure on related assets.
Ethena price has been on a mostly downward trend since September 9th, continuing to trade within what appears to be a descending parallel channel. In technical analysis, a parallel channel is a pattern in which price oscillates between two downward trend lines, suggesting consistent bearish momentum.
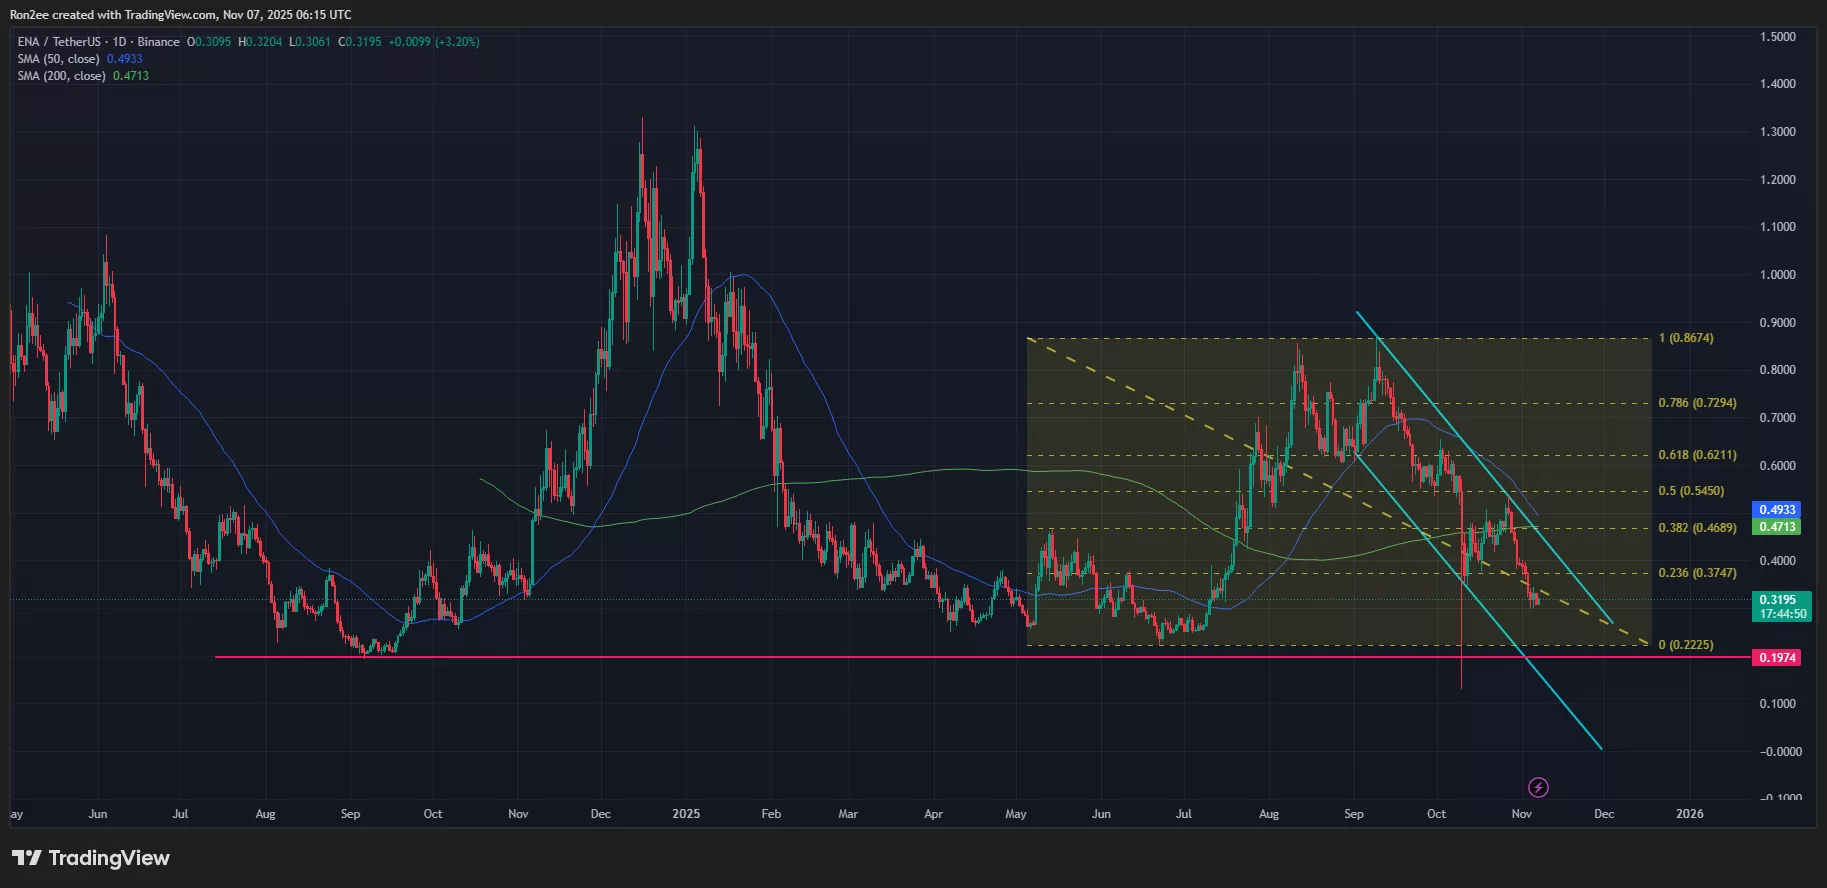
Therefore, as long as prices follow this pattern, they may continue to fall further.
The Supertrend indicator flashes red when it breaks above the price line, a clear sign of growing bearish sentiment.
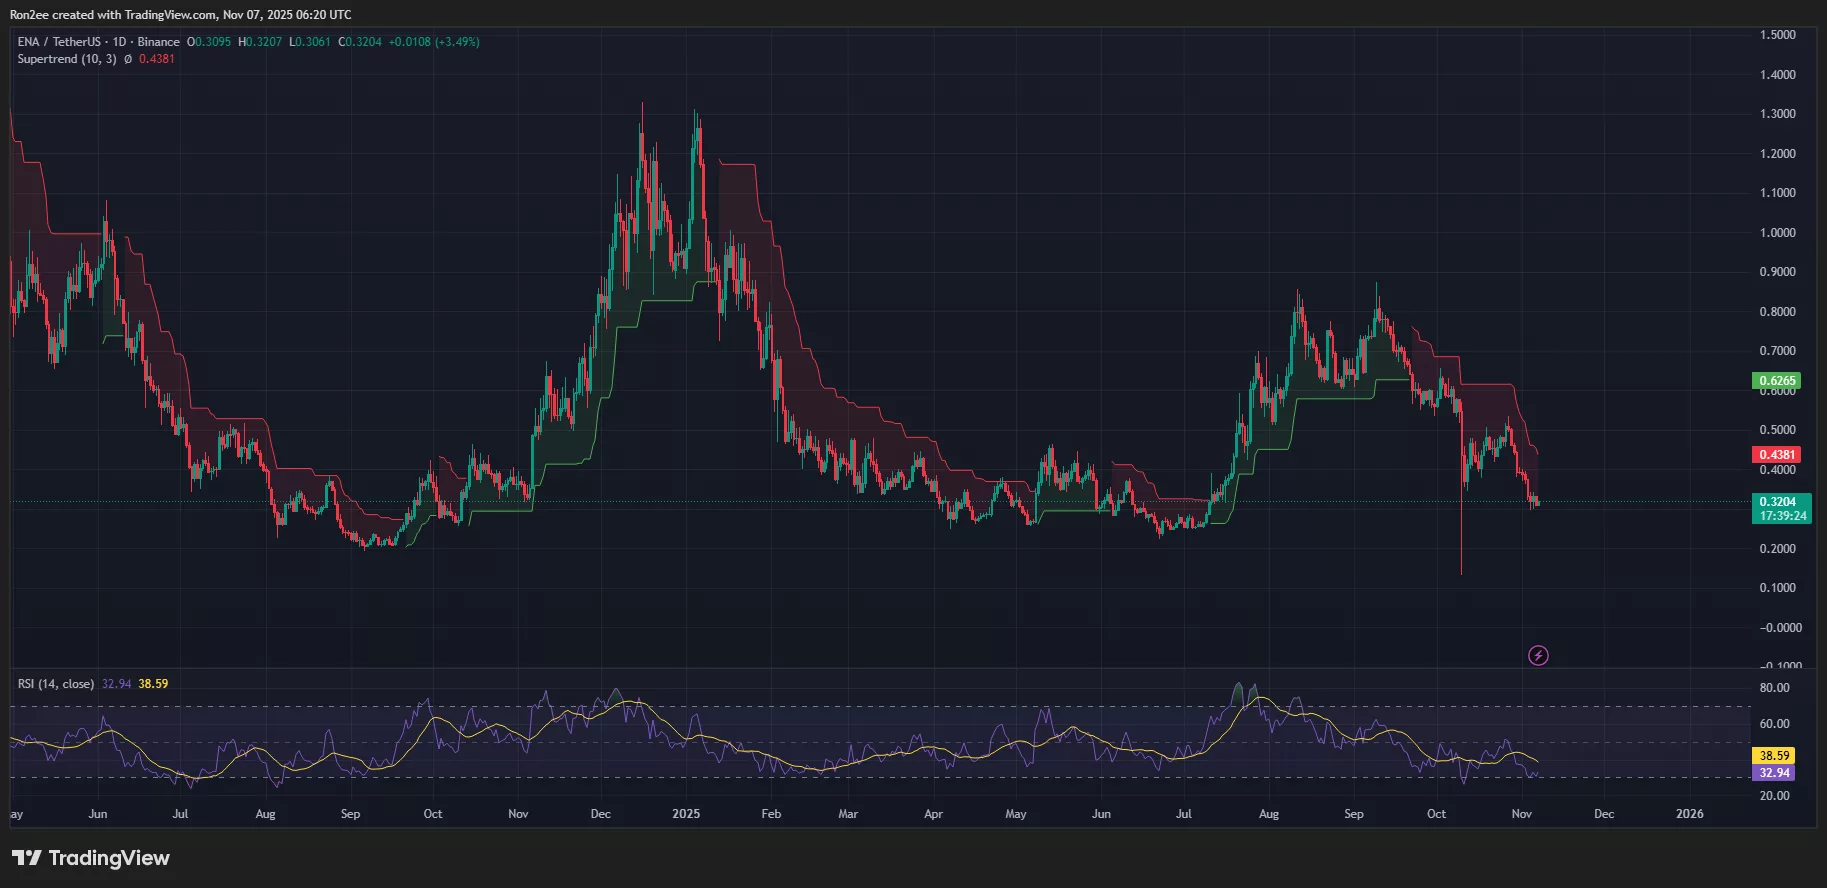
More importantly, the 50-day SMA is expected to fall below the 200-day SMA, forming a “death cross”, a historically bearish pattern that often signals deeper losses.
However, the RSI is hovering around 32, close to the oversold threshold. As such, a short-term rebound may be expected before the ongoing downtrend resumes.
As it stands, Ethena appears to be at risk of further decline to $0.197, 36% below current price levels, a zone last seen in September 2024.
Conversely, a sustained rebound above the 200-day SMA of $0.47 is also roughly in line with the 38.2% Fibonacci retracement level, indicating an exit from a bearish setup and likely opening the door to a more optimistic reversal.
Disclosure: This article does not represent investment advice. The content and materials published on this page are for educational purposes only.