
October was a tough month for Bitcoin, posting its worst performance since 2018 as traders became more cautious. Despite macroeconomic tailwinds, increased ETF outflows and weaker institutional demand are contributing to weak market sentiment. As Bitcoin prepares for November, traditionally a bullish month, analysts are warning that record volatility could be on the horizon, with on-chain data hinting at a potential change in price behavior.
- Bitcoin’s October performance was its worst since 2018, and traders are increasingly cautious about the outlook.
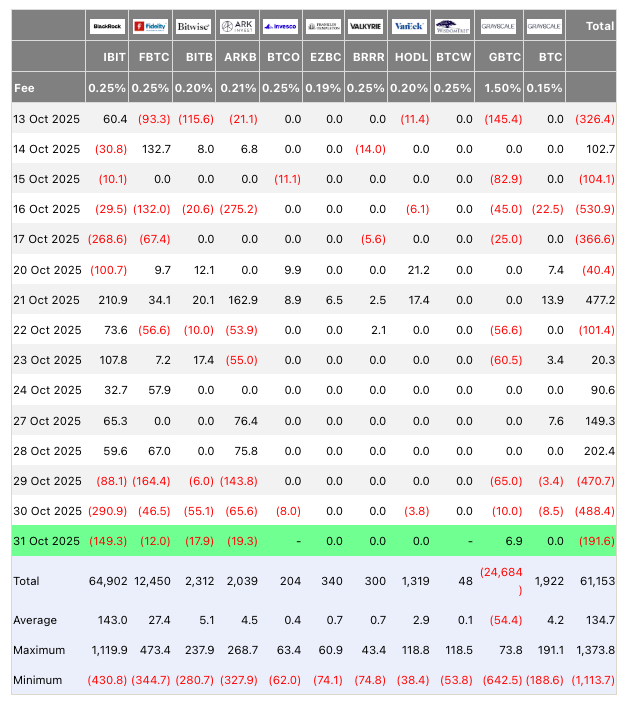
- ETF outflows have resumed, indicating increasing selling pressure despite favorable macroeconomic conditions.
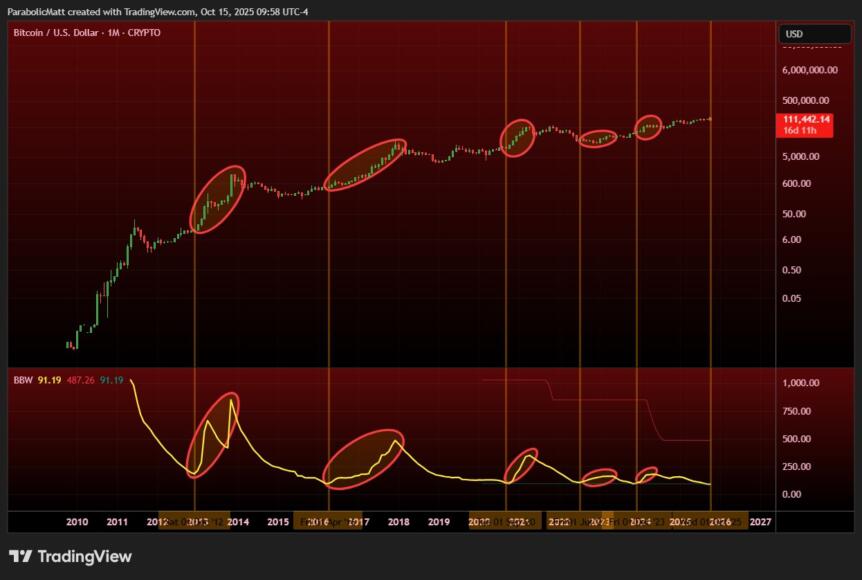
- Market volatility is expected to increase, as Bollinger Bands data suggests.
- Institutional demand appears to be weakening, impacting Bitcoin’s price resilience.
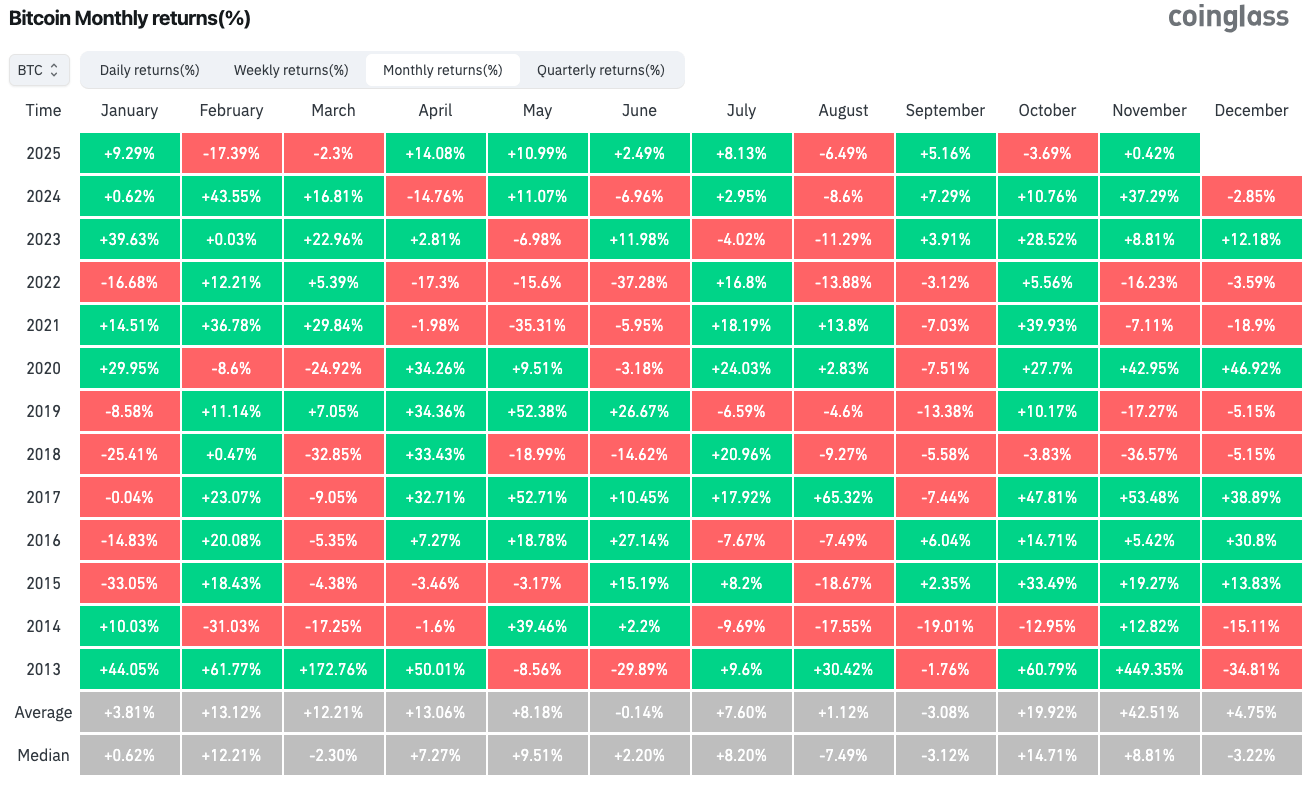
- Historically, Bitcoin has had a large monthly rally in November, which could lead to increased volatility.
Bitcoin (BTC) hovered around $110,000 on Saturday as traders remained bearish following a lackluster Uptober that failed to live up to expectations. Despite some recovery from losses earlier in the week, overall sentiment remains cautious.
Bitcoin demand slump ends October on a cautious note
Recent data from Cointelegraph Markets Pro and TradingView reveals that Bitcoin prices are on track to recover from Friday’s decline, driven by sustained selling pressure throughout the week across US exchanges and Bitcoin ETFs.
On-chain analysis by Glassnode shows that ETF net outflows indicate increased selling pressure from traditional financial investors and declining interest from institutional investors. Following Thursday’s $488 million outflow, Friday’s outflows reached $191 million, further underscoring investors’ cautious sentiment.
Despite the Fed’s announced interest rate cuts, market participants largely ignored macroeconomic tailwinds, and Glassnode said a hawkish tone in December dampened optimism. “The initial rally has subsided as traders return to cautious mode, and that shift is clearly reflected in the Bitcoin options market,” said one analyst.
“The initial rally has subsided as traders return to cautious mode, and this change is clearly reflected in the BTC options market.”
Cryptocurrency investor and entrepreneur Ted Pillows described the current market as a “time-based capitulation” for Bitcoin, warning that a weekly close below $100,000 would confirm a downward trend. He emphasized that a reversal would require sustained consolidation above this level, with the key levels of interest being $107,000 and $116,000.
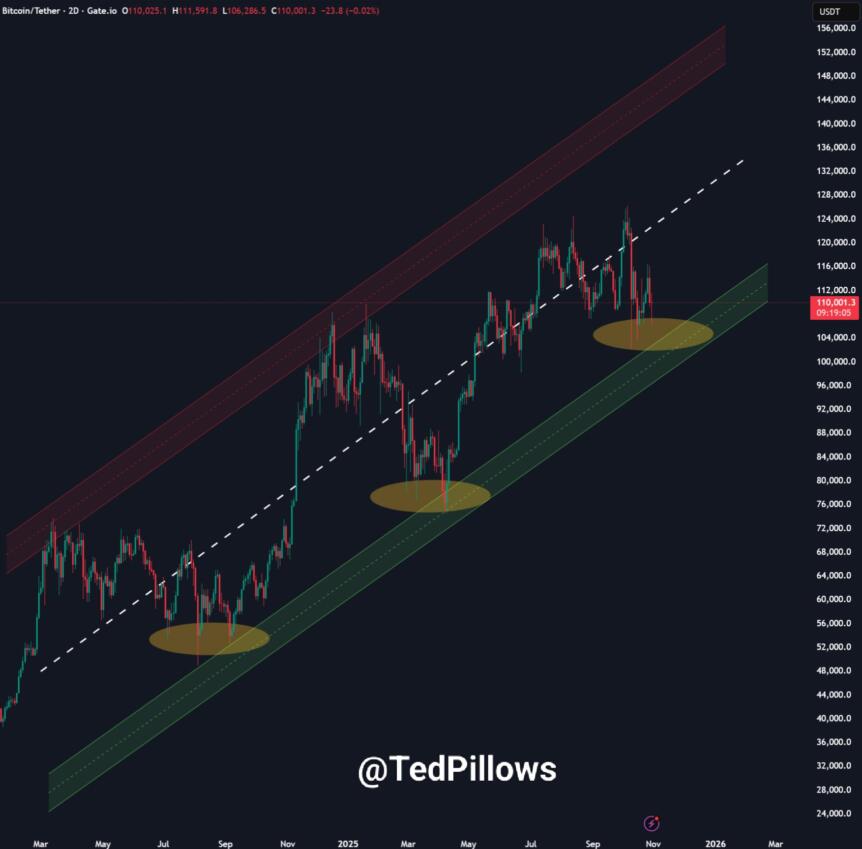
Trader Daan Crypto Trades emphasized that a decisive move in Bitcoin’s range will depend on whether it breaks above $116,000 or below $107,000, which is likely to indicate a new directional trend. Currently, the market is characterized by sideways movement and traders are waiting for confirmation before committing to new positions.
Volatility is expected to increase as a Bollinger Band signal
Bitcoin’s negative performance in October, which saw it drop 3.7%, was its worst October since 2018, and traders are focused on potential volatility. data from another red october This highlights the challenging environment ahead of November, which has historically produced strong gains for Bitcoin, with an average increase of 42.5% since 2013, according to CoinGlass.
Market analyst Matthew Hyland noted that the Bollinger Bands volatility indicator is currently at unprecedented levels for Bitcoin, suggesting that significant price movements may be imminent. The indicator’s extreme readings prompted a warning from veteran market observer John Bollinger, who suggested that traders should soon brace for increased volatility across Bitcoin and other major cryptocurrencies.
As crypto markets brace for potential disruption, traders remain focused on key resistance and support levels, awaiting clearer signals that will dictate the next big move in the evolving digital asset landscape.
This article does not contain investment advice or recommendations. All investment and trading moves involve risk and readers should conduct their own research when making decisions.