
Bitcoin price is hovering around $105,300, down about 0.8% in the past 24 hours and about 5% this month. Still, this week seems surprisingly stable. Bitcoin briefly fell to nearly $100,000, but managed to recover despite a sharp increase in selling pressure.
The contrast between rising selling pressure and relatively stable prices suggests that something deeper is going on beneath the surface.
sponsored
Data shows selling pressure surges more than 1,300%
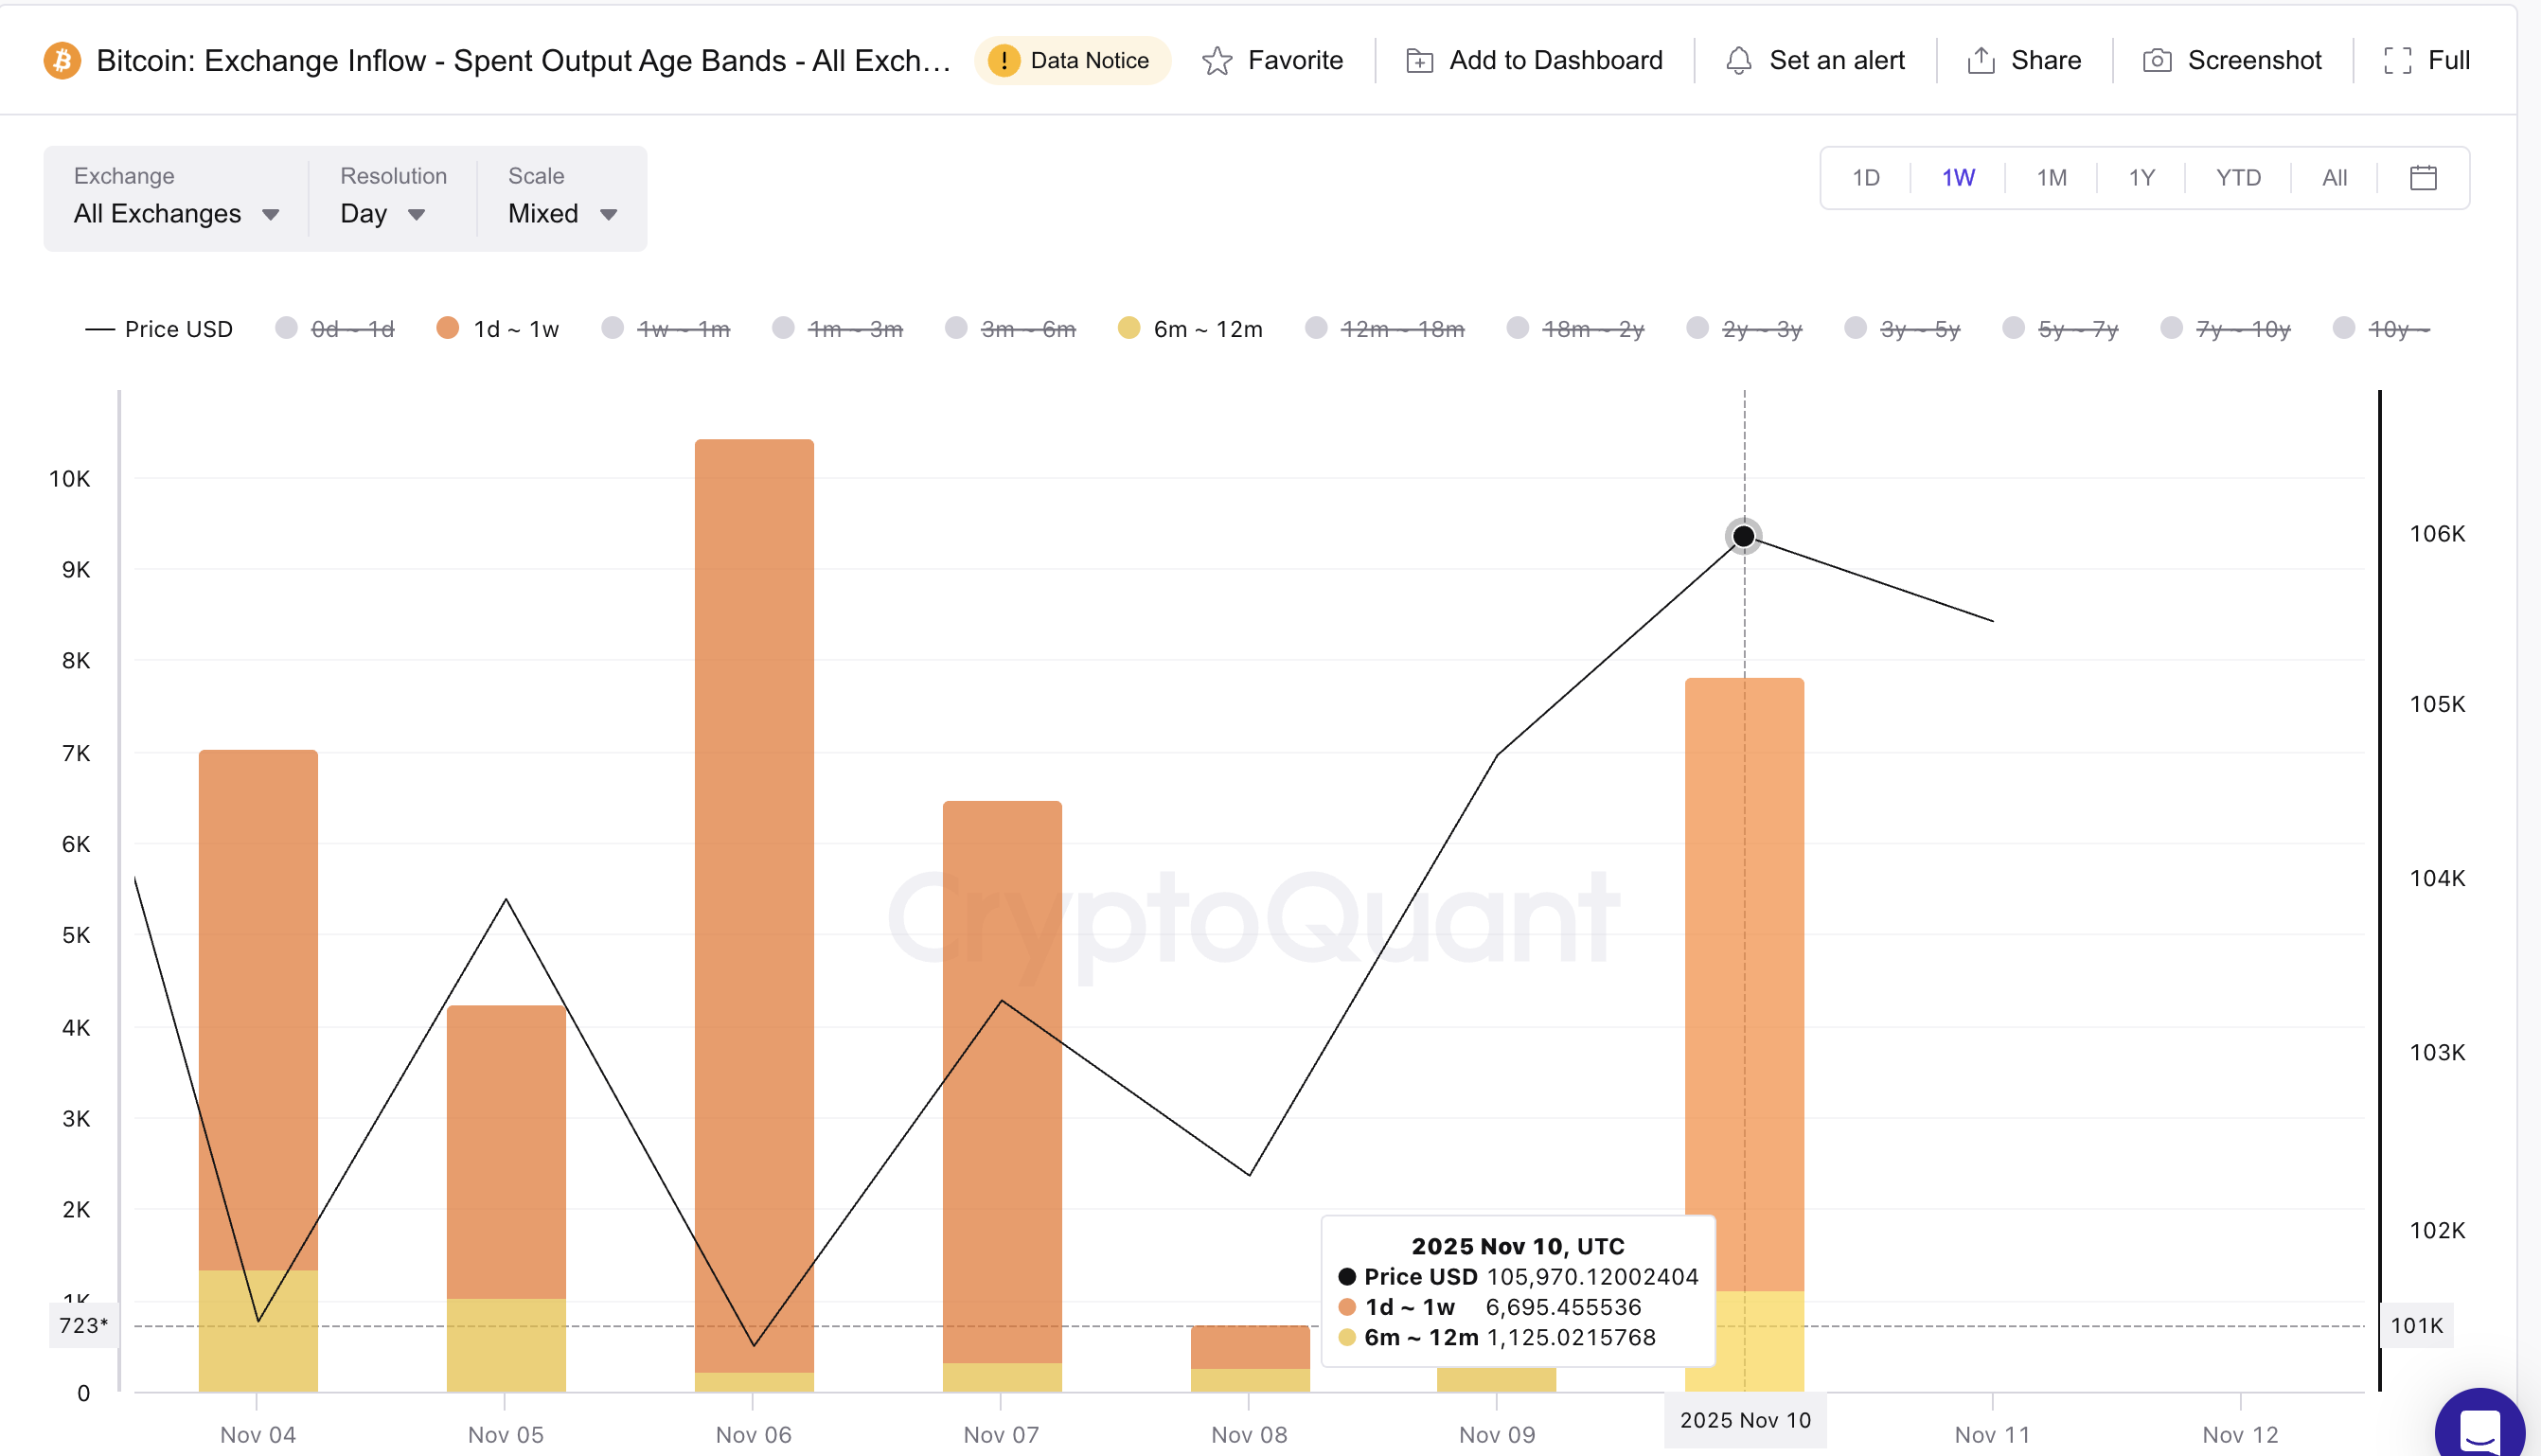
On-chain data from Spent Output by Age Range, which tracks how old coins are moved to exchanges, reveals a sudden spike in BTC sales.
Short-term holders (1-day to 1-week wallets) increased their exchange transfers from 470 BTC on November 8th to 6,695 BTC on November 10th, a jump of over 1,300%.
At the same time, exchange inflows for medium-term holders (6 months to 1 year wallets) increased from 268 BTC to 1,125 BTC. This is an almost 300% increase in selling pressure. This rally indicates profit-taking by both short-term and intermediate-term investors, and is often a sign of declining confidence or profit-taking in a resistance zone.
Want more token insights like this? Sign up for editor Harsh Notariya’s daily crypto newsletter here.
sponsored
Typically, this increase in currency inflows puts downward pressure on prices. This time, however, the market is holding its ground, suggesting new demand is coming in to offset sell orders.
Looming bullish crossover signal suggests rebound may be stronger
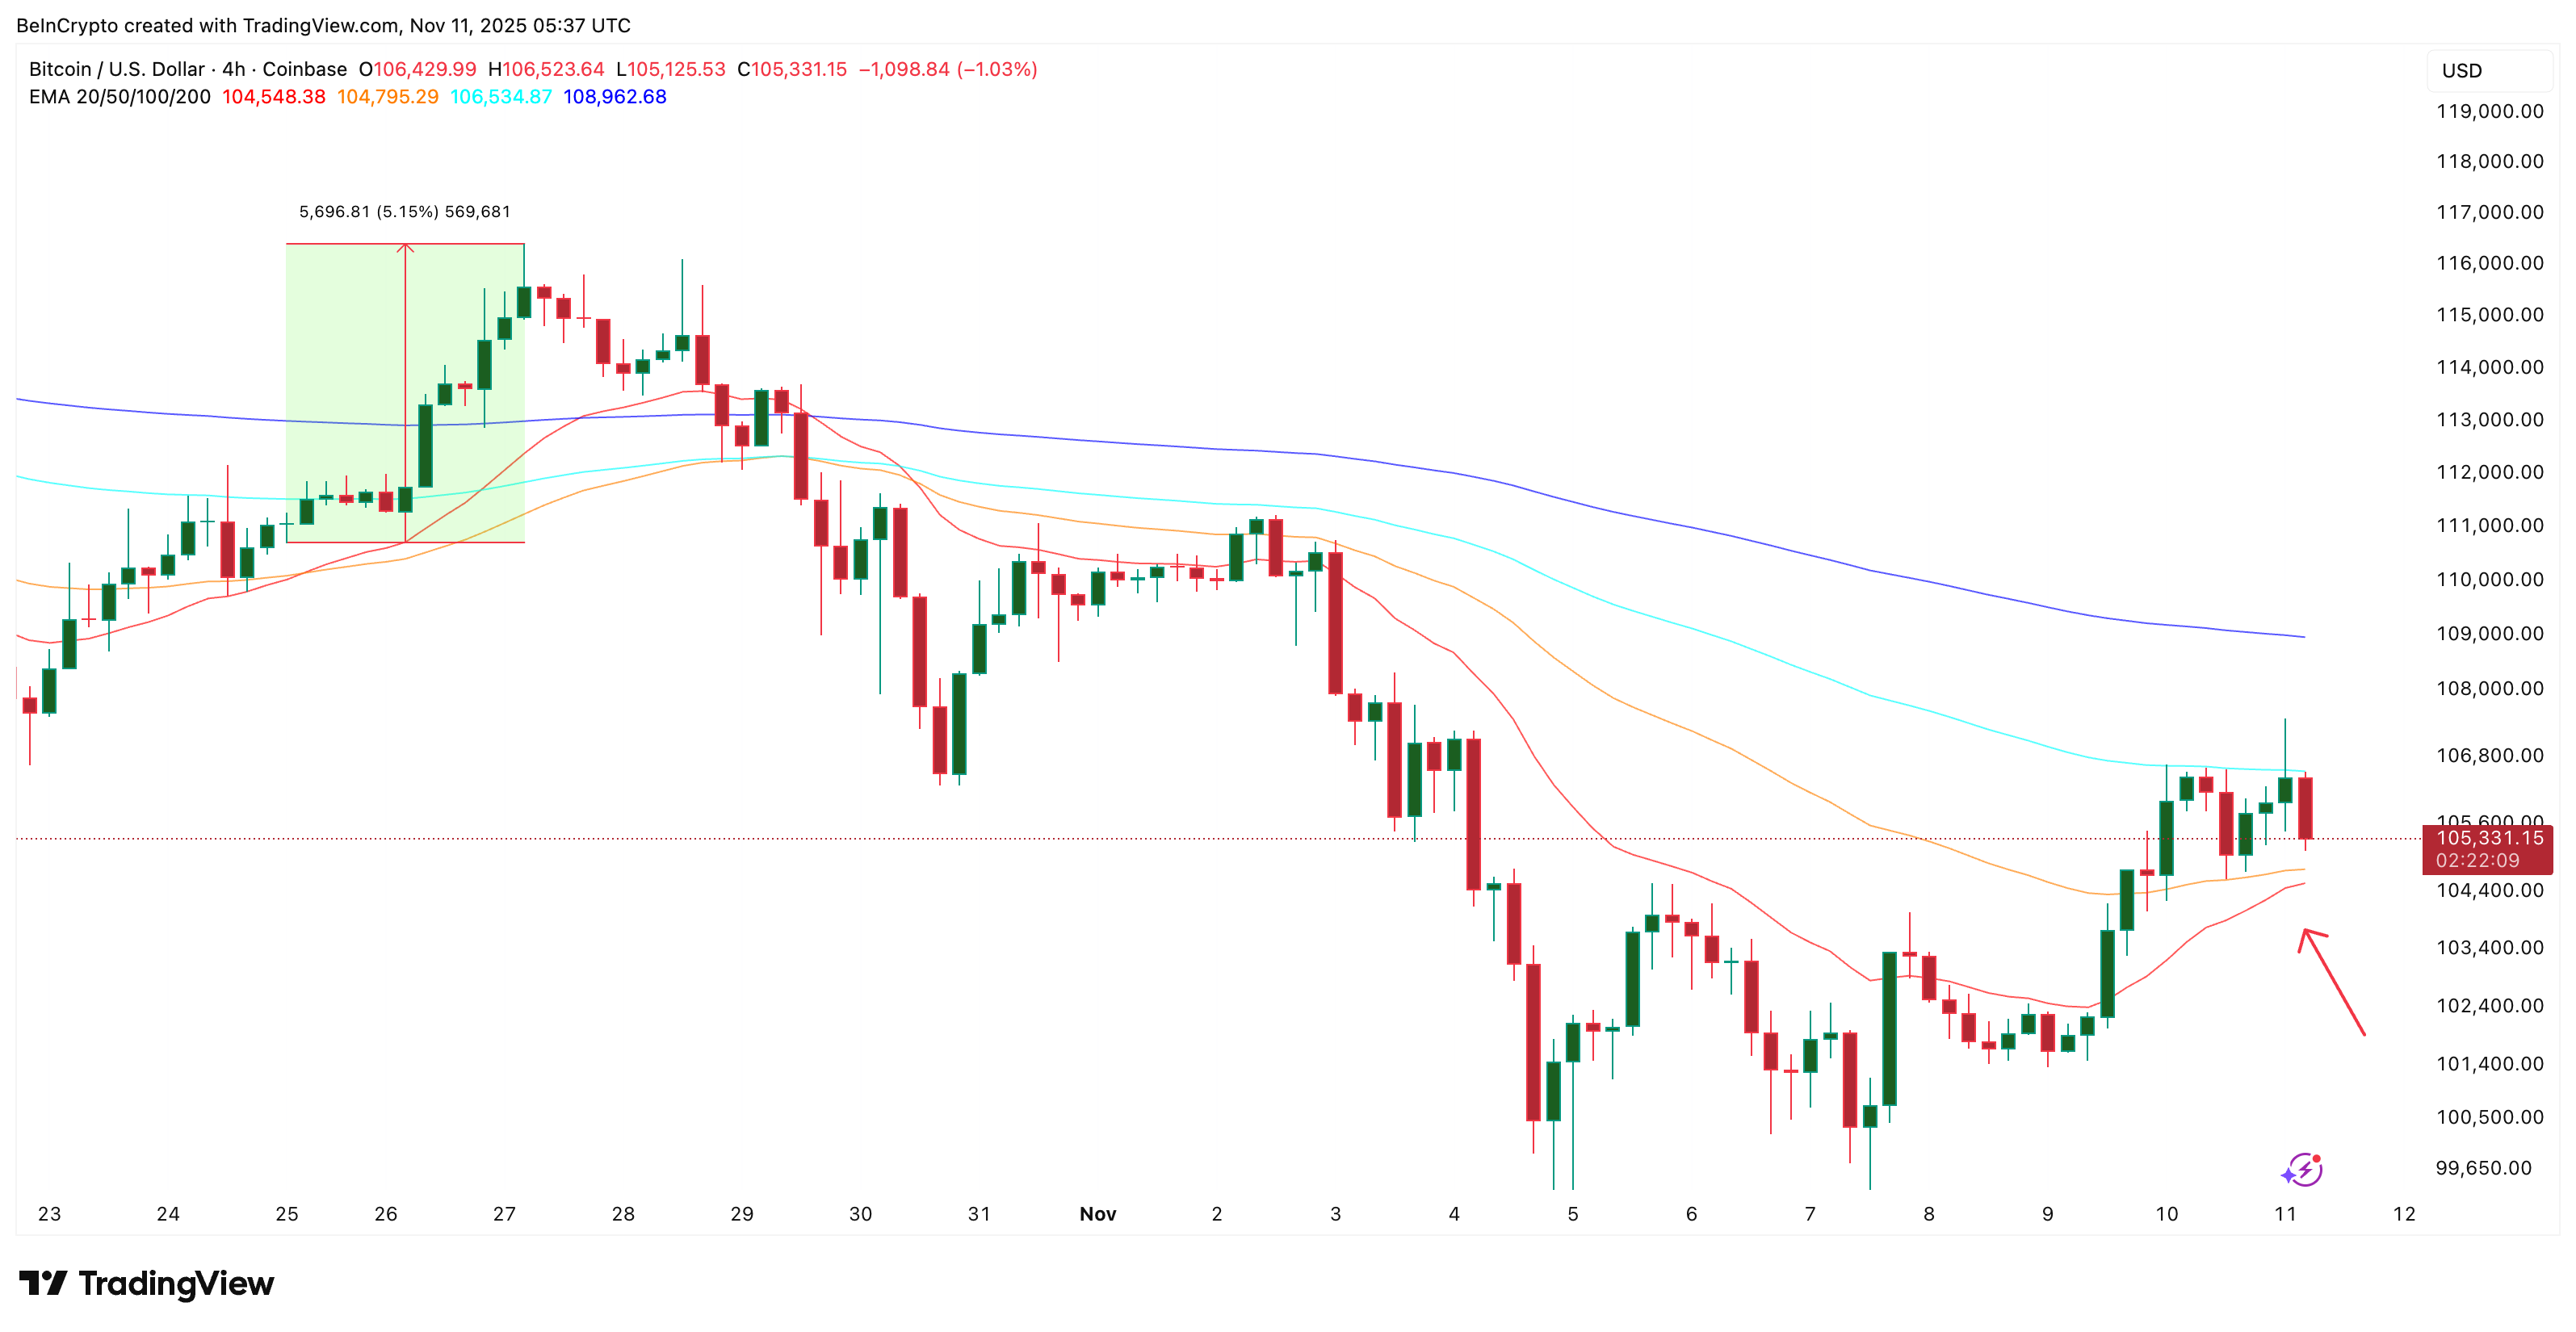
On short-term charts, technical signals support this resilience. Exponential moving averages (EMAs), which smooth price data and identify trend direction faster than standard moving averages, are showing new bullish crossovers. The 20-period EMA is closer to the 50-period EMA, and when a shorter EMA breaks out above a longer EMA, it often signals strengthening momentum.
The last time this pattern appeared was around October 25th, when Bitcoin rose more than 5% within a few days.
sponsored
This suggests that despite the heavy sell-off, underlying momentum may be picking up again. Traders are closely watching to see if this crossover completes as evidence of growing buying pressure behind the scenes.
Large holders step in as key Bitcoin price levels determine next move
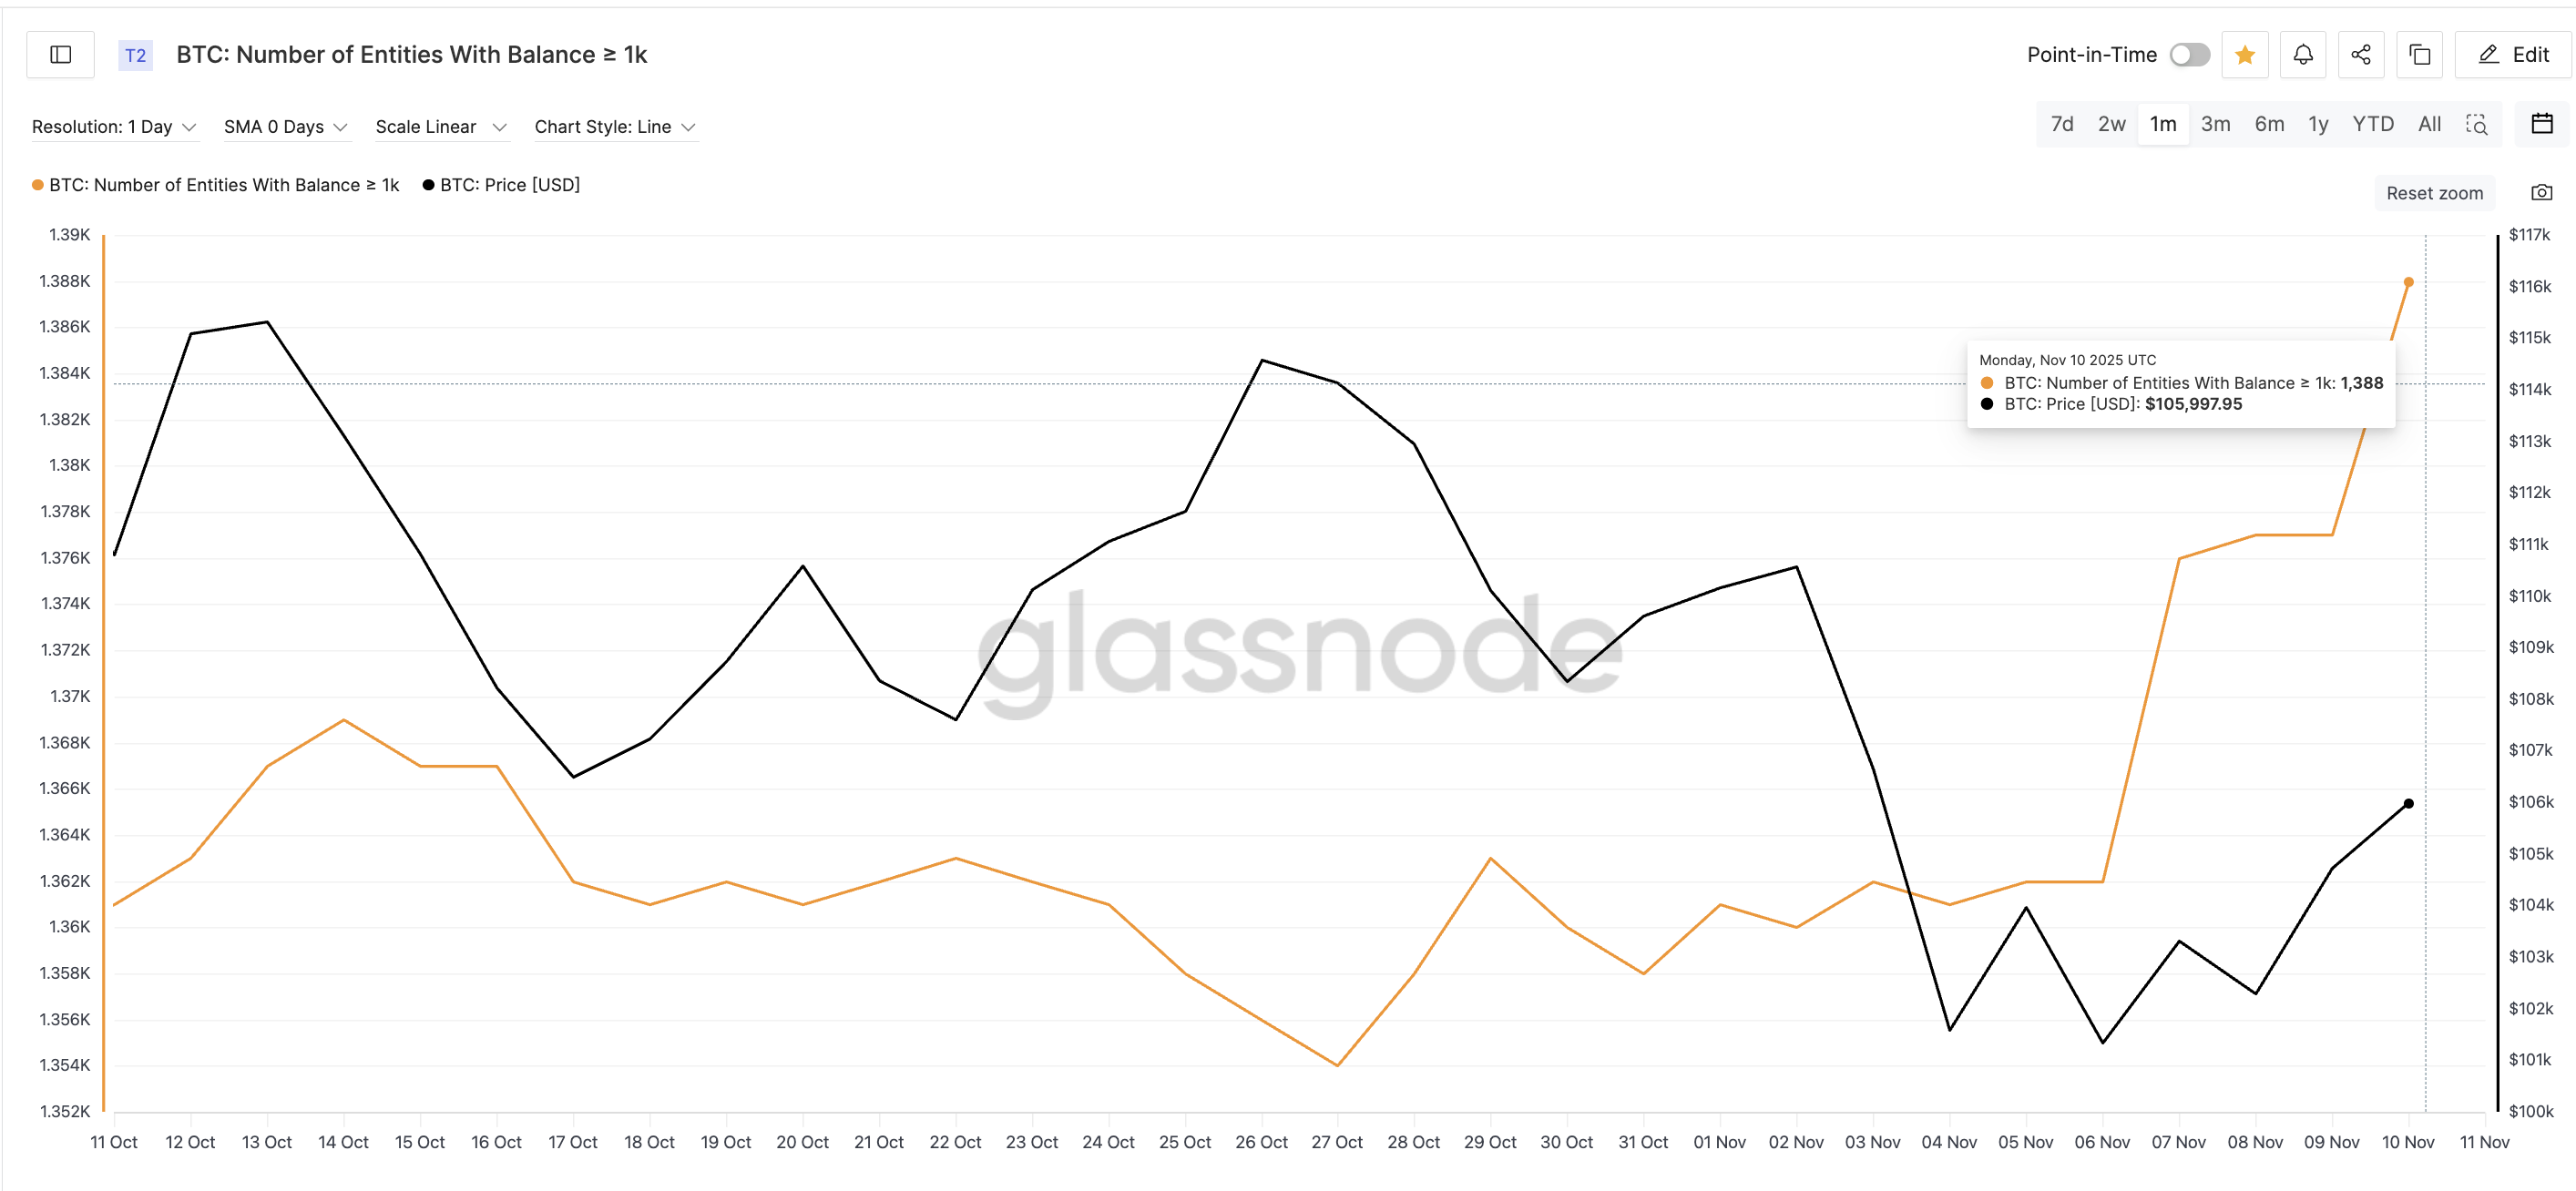
Supporting the rebound theory, Whale Wallet data shows that accumulation is increasing. Between November 6th and 10th, the number of entities holding 1,000 BTC or more increased from 1,362 to 1,388, an increase of approximately 1.9%.
At current prices, that means more than 26,000 BTC (approximately $2.7 billion) will be added to large wallets. This is enough to absorb a significant portion of short-term selling.
sponsored
If this accumulation continues, it could help sustain Bitcoin’s rebound and retest key resistance levels. The first test price was $105,500 and since November 9th, movement in this zone has been rejected.
A clean break above the day’s closing price could open the door to $109,700, the upper bound of Bitcoin’s gains since October 31st. Goals beyond that include $112,600 and $116,400. However, such Bitcoin price movements will require continued whale attention and mitigation of cohort-based selling.
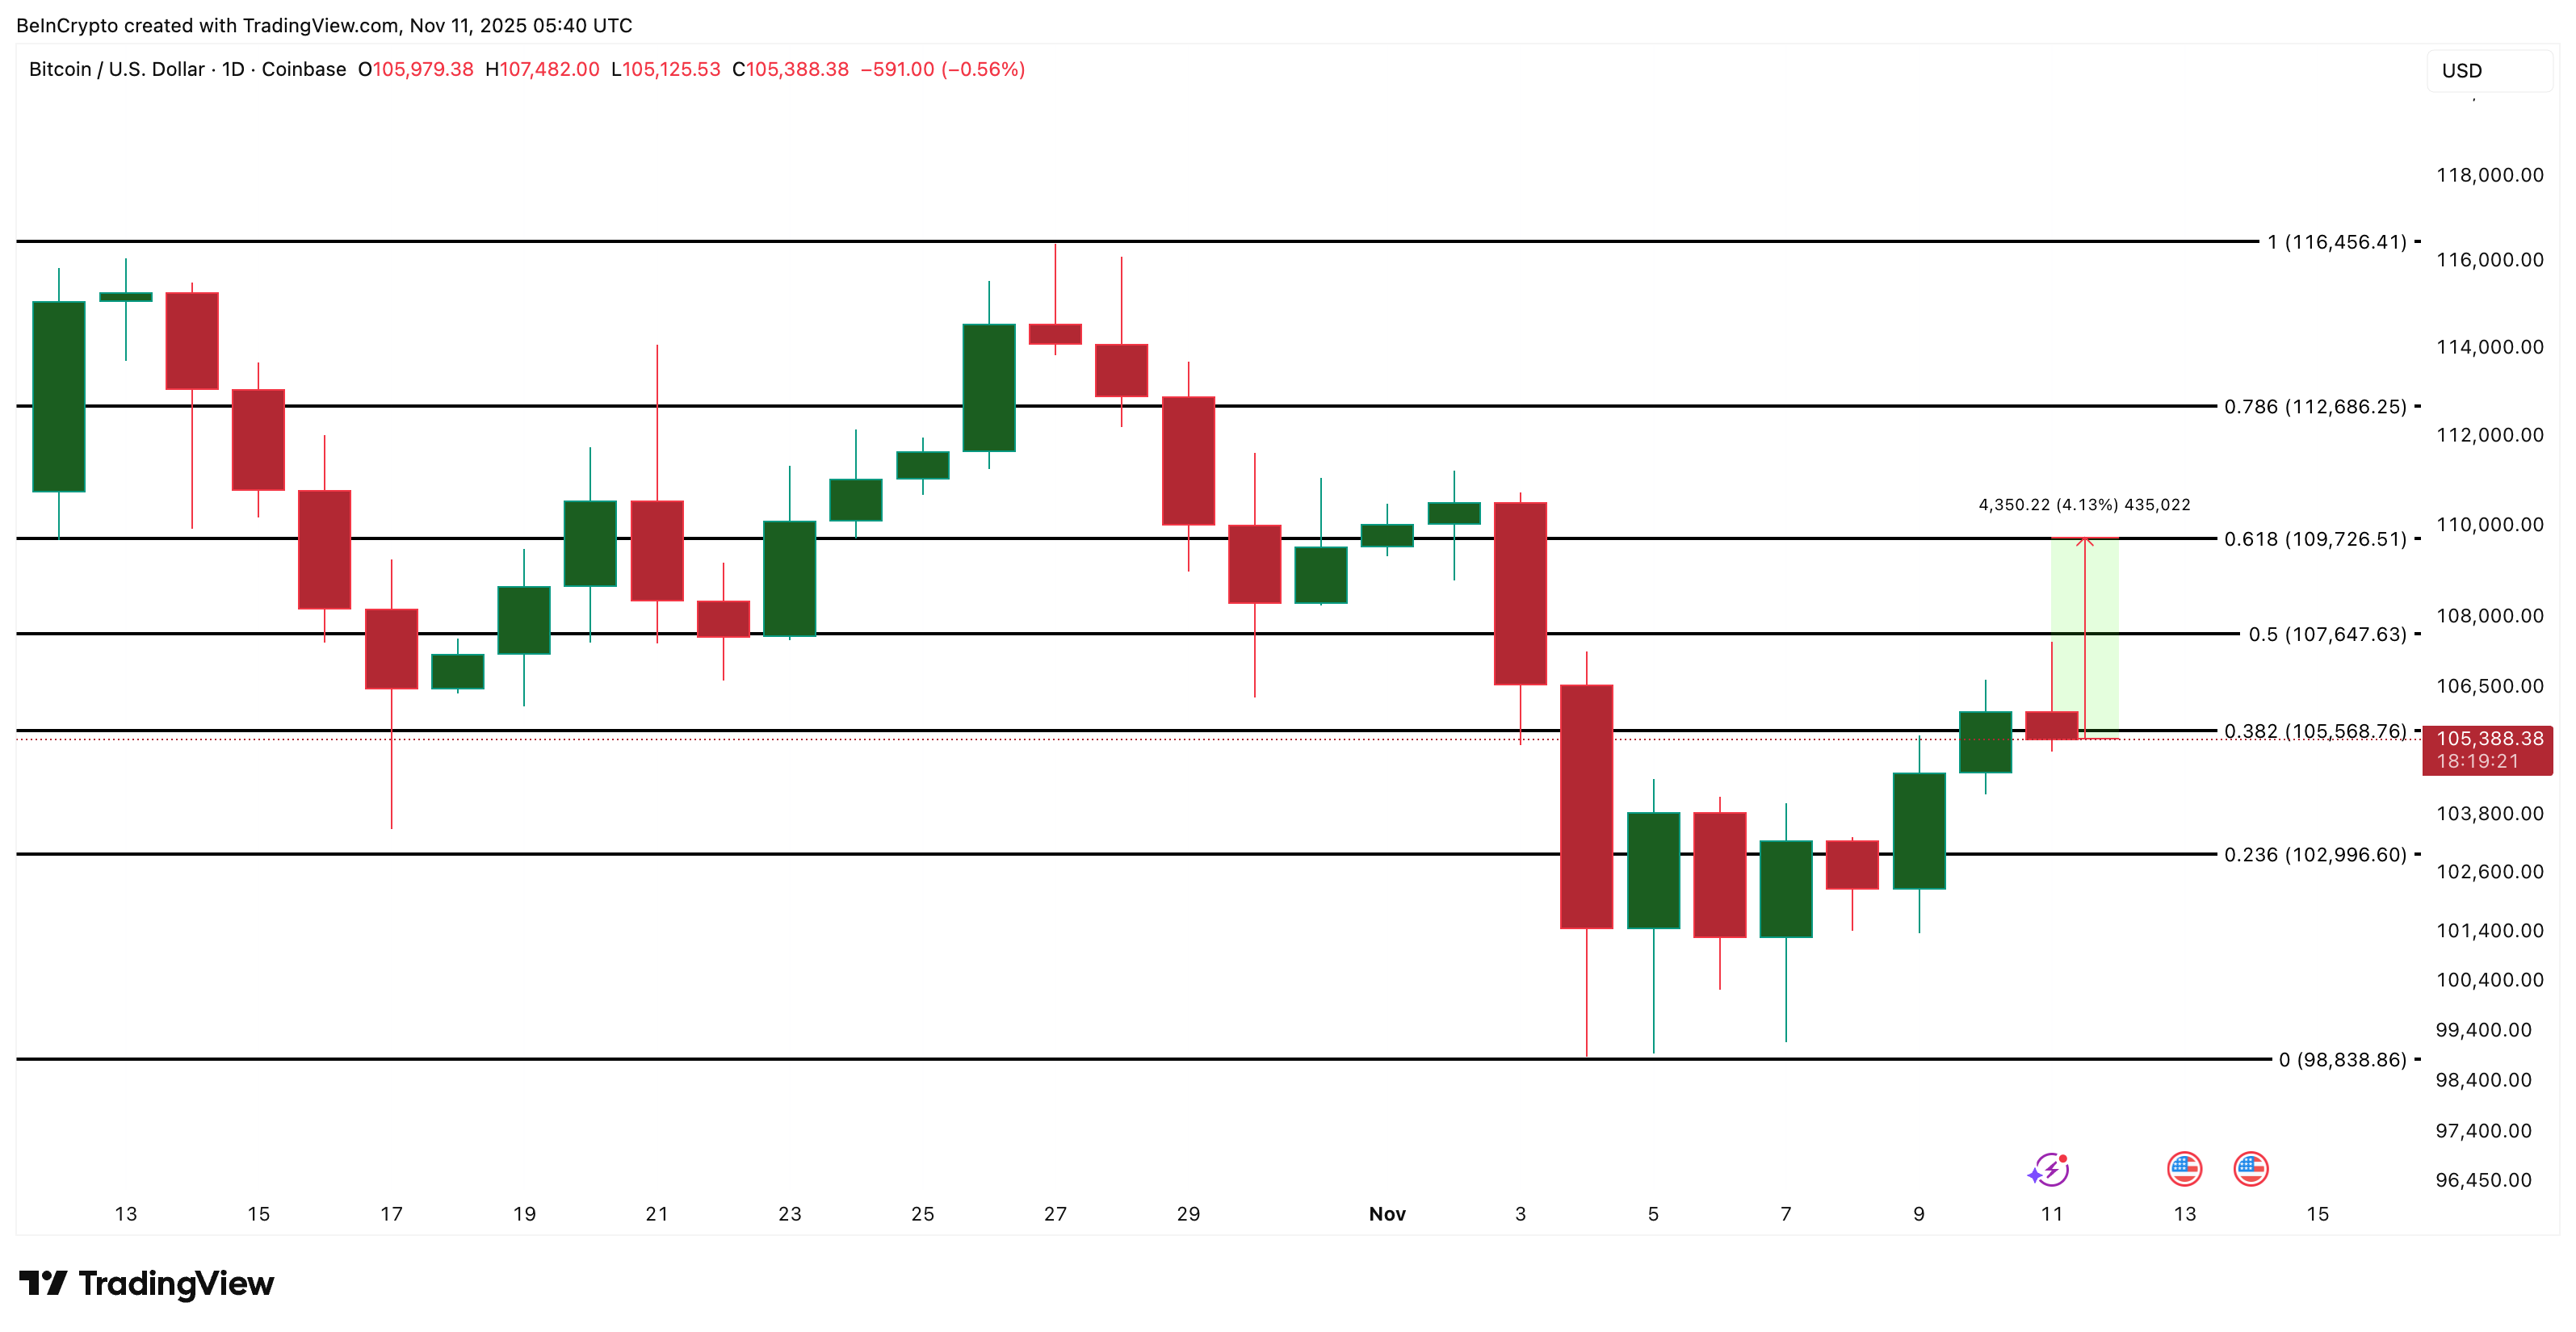
However, a daily close below $102,900 could weaken the structure, exposing $98,800 and invalidating the short-term bullish setup.