
Bitcoin prices have fallen past their October peak, and the market is now focused on whether buyers will defend the crucial $91,000 to $97,000 support zone.
summary
- Bitcoin has eased its decline after a solid peak in October and is currently trading near key support levels.
- On-chain indicators point to a potential test of the $91,000 to $97,000 “profit floor” that buyers have repeatedly stepped into this cycle.
- The trend is holding, but the momentum is slowing.
Bitcoin is trading around $102,292, down 1.3% over the past day. The market has weakened over the past week and is now down about 7% in seven days, and about 16% over the past month. The current price is about 18% below the all-time high of $126,080 set in early October.
Trading activity increased slightly over the past 24 hours, with spot trading volume increasing 14.8% from the previous day to approximately $69.5 billion. In futures, total trading volume increased 8% to $107.5 billion and open interest increased 1.4% to $69.6 billion.
When open interest rises while price falls, it usually means traders are adding to positions rather than exiting them, potentially extending the current trend.
MVRV shows cooling momentum rather than complete reversal
A Nov. 6 analysis by CryptoQuant contributor Sunny Mom highlights the growing divergence of Bitcoin (BTC)’s MVRV ratio, which tracks unrealized gains across the network.
The MVRV ratio continues to be supported in the 1.7-1.8 range during this cycle. Since the beginning of 2024, this region has served as a “profit bed” for the market. Markets typically stabilize when selling pressure subsides. If price and sentiment retest that region, it will roughly align with the $91,800 to $97,200 price range.
Further technical weight is given by the fact that this range also overlaps with a sizable unfilled CME gap of nearly $92,000. Prices rose early in the cycle, but unrealized gains have been compressed, as the current bearish MVRV divergence shows.
This suggests that buyers are becoming more cautious, but does not imply that the cycle top is confirmed. A similar divergence appeared in 2017, before Bitcoin’s final parabola.
Meanwhile, recent data shows that corporate Bitcoin accumulation slowed in October. Companies purchased approximately 14,400 BTC, a significant decrease from 38,035 BTC in September. The market capitalization of companies holding Bitcoin has also declined relative to their holdings, indicating that investors have become more cautious following the recent decline.
Technical analysis of Bitcoin price
The cautious short-term outlook is reinforced by the fact that Bitcoin is still trading below all important short-term and long-term moving averages. Market cooling, rather than oversold depletion, is reflected in the Relative Strength Index near 37.
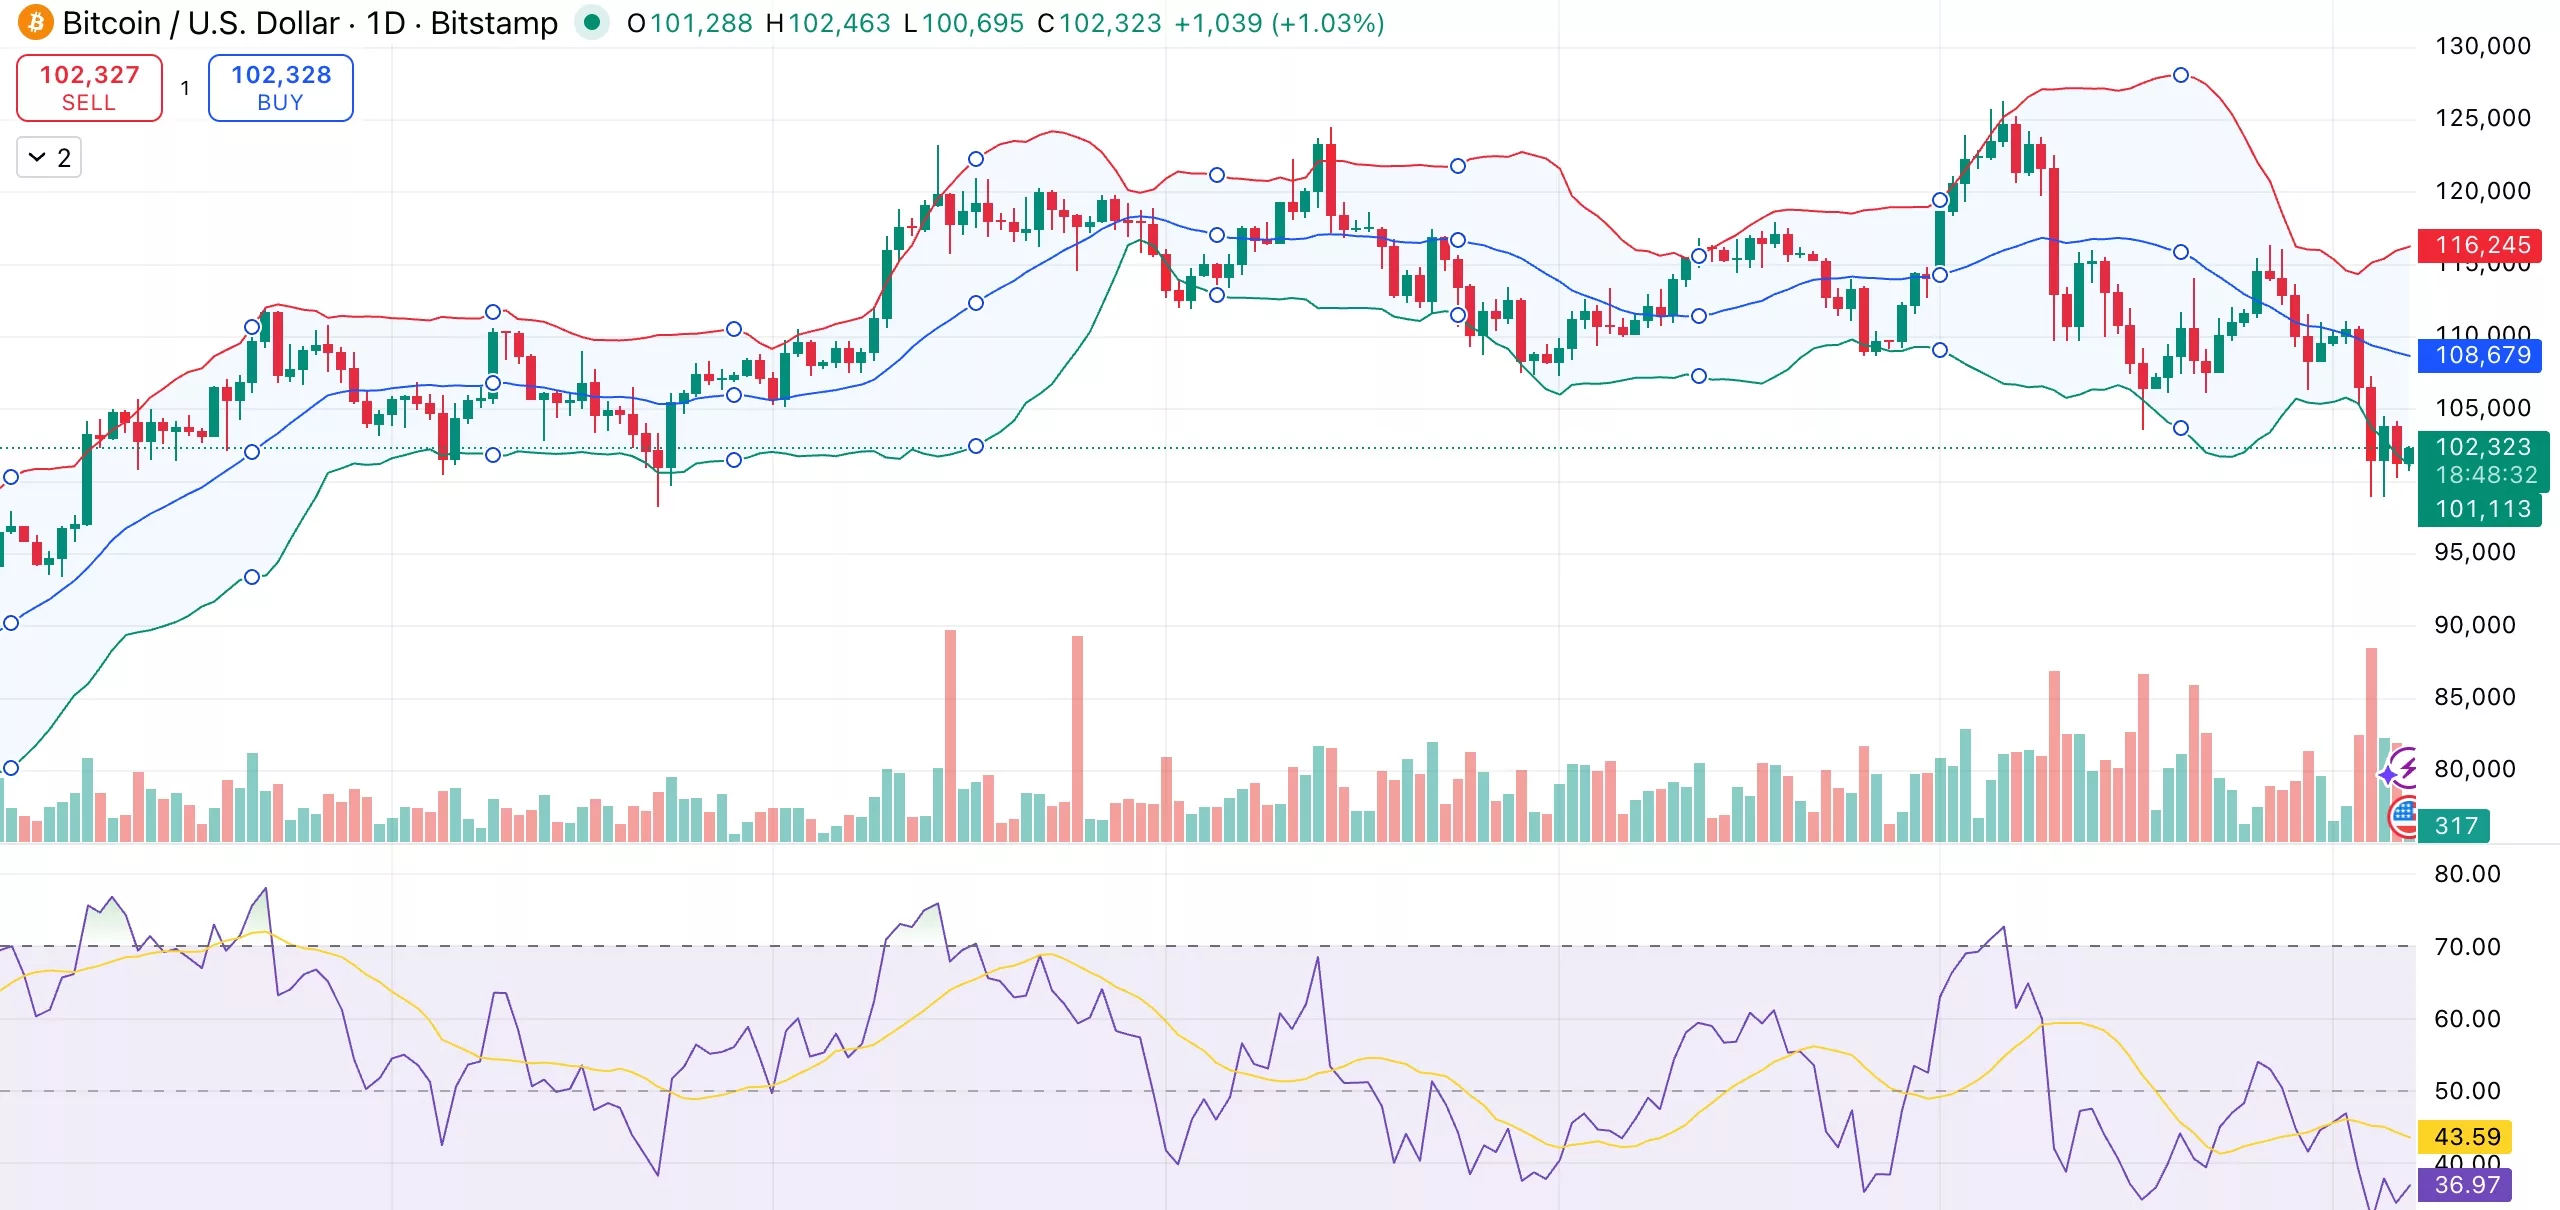
Commodity channel indexes and momentum measurements suggest early signs of stabilization of buying at current levels or value-based buying. At the same time, the MACD is still negative and most short-term and long-term moving averages are still above price. This indicates that trend pressure is still to the downside in the short term.
A break above $105,800 could restore upside momentum, but failure to break above $97,000 will open the door to CME gap territory around $92,000.