 Drop After U.S.–China Deal Part of Bullish FOMC Link…")
Bitcoin plummeted on October 30th, dropping from around $116,000 to a range of $108,000 to $110,000 as traders reacted to new global developments. However, the next day, buyers moved in and the price of Bitcoin rose above $109,000, with bulls now targeting $110,000. The decline followed the announcement of a new trade deal between the US and China that would ease tariffs and signal a thaw in relations between the two largest economies.
While the deal reduced geopolitical tensions, it also prompted a flight from risky assets as investors returned to stocks and commodities. Meanwhile, cautious signals from the US Federal Reserve (Fed) increased pressure. Officials suggested the pace of future interest rate cuts could slow, potentially dampening hopes for more liquidity support that fueled Bitcoin’s initial rally.
Still, the current decline is consistent with a familiar pattern seen during previous FOMC (Federal Open Market Committee) periods. Bitcoin has often fallen after major policy events, only to rebound sharply when leveraged positions are reset. If the past rhythm holds, buyers may wait for the next recovery cue, a bullish fractal that has repeated itself many times this year.
Recurring FOMC pattern matches current liquidity settings
The market’s latest move appeared to be an extension of a familiar structure that several analysts have been tracking throughout this year’s Federal Open Market Committee cycle. Each time the Fed updated its policy, it triggered a short-term correction in Bitcoin. This was followed by a sharp rebound as leverage was reset. Analysts such as Alex Weissy and Ted Pillows emphasized that the same rhythm appears to be repeating itself after the Oct. 29 policy decision. Bitcoin’s recent decline was about the same size as June, July, and September.
Alex Weissy pointed out that Bitcoin fell by 5-7% after each FOMC event and then regained new highs in the weeks following.
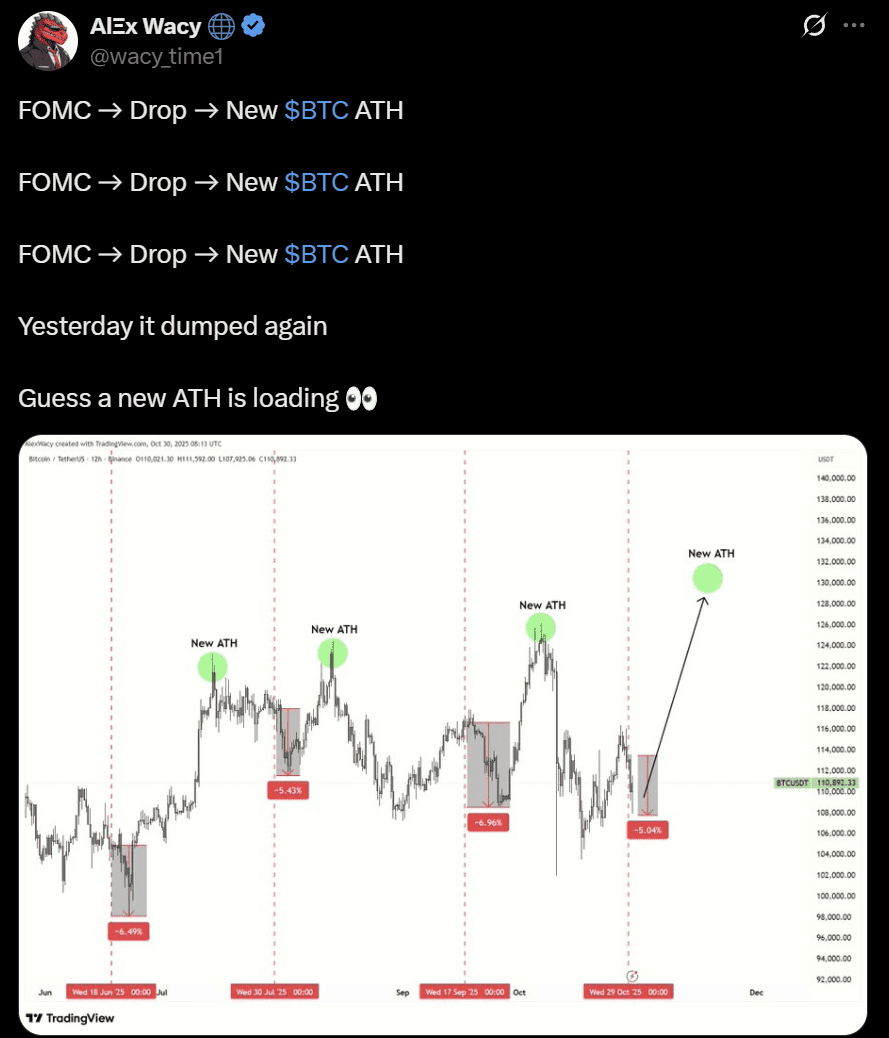
Wacy’s chart suggested that traders typically reduce risk in response to policy uncertainty and re-enter when transparency returns. This turned post-FOMC volatility into an accumulation opportunity. Analysts viewed the current decline as part of a periodic fractal, a controlled correction that historically occurs before hitting new all-time highs.
Ted Pillows supported the timing pattern with structural evidence.
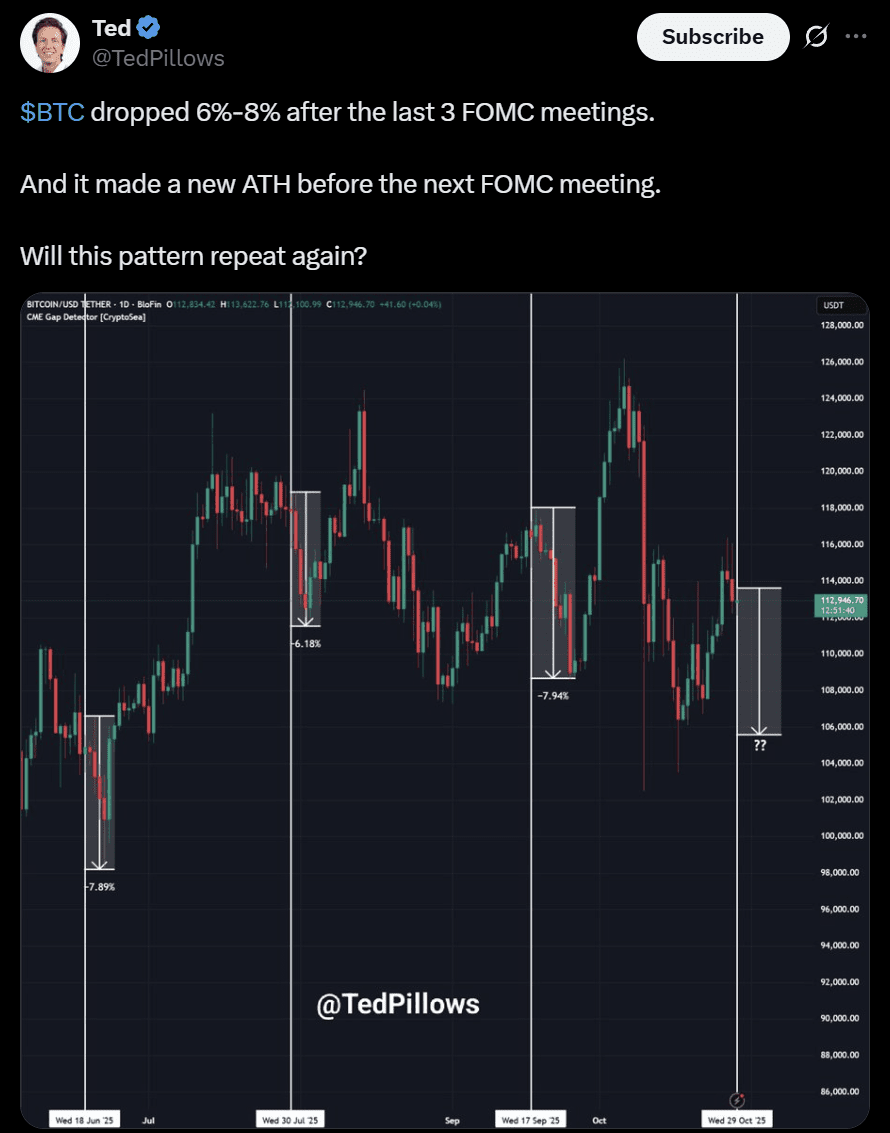
Ted’s analysis shows that Bitcoin has fallen sharply again after the previous meeting, reflecting the same corrective symmetry. He noted that each decline is followed by a recovery above the previous high, suggesting that flows to institutional investors often resume once macro dust subsides.
Kamran Asghar added a liquidity-based layer to this setup.
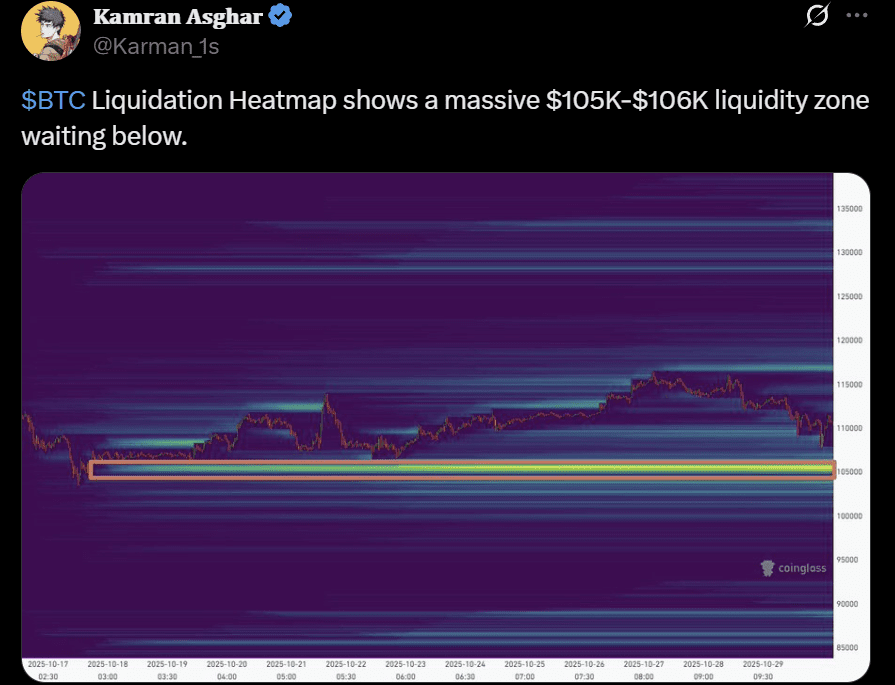
Analyst liquidation heatmap reveals clustering between $105,000 and $106,000. The region acted as a price magnet where long-term liquidations tended to be concentrated. Mr Asghar saw this as the final stage of leverage cleansing before re-accumulation.
Complementing that, Wimar X observed massive outflows from Binance wallets during the slide. This implied mechanical selling pressure as exchanges exited leveraged positions.
Analysts highlight contradictory structures but agree on key BTC turning points
Bitcoin’s current setup has left analysts divided between structural caution and optimism about a sharp rebound. This divergence reflects how the market has balanced short-term weakness with the possibility of a return to bullish territory after liquidity pressures ease.
Krypto Patel noted that Bitcoin has completed a bearish retest in the $116,000-$117,000 zone, turning into a major resistance area. Analysts maintained a bearish bias below this level. He said the market is vulnerable to deeper retracement targets around $105,000, $93,000 and $76,000.
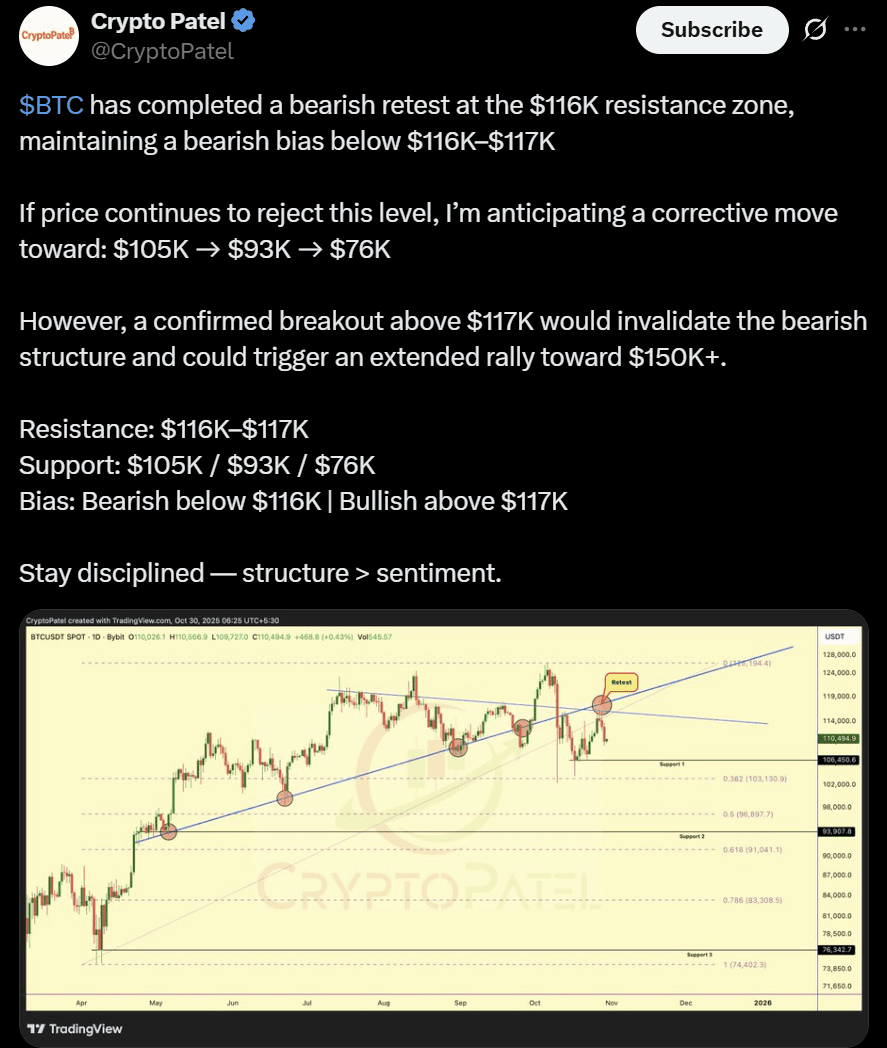
Patel’s chart was structured as a complete rejection of the previous uptrend line, a typical setup before a mid-cycle reset. However, he emphasized that if the daily close is confirmed above $117,000, the bearish formation could be invalidated and the uptrend towards $150,000 could be rekindled.
Will there be a Bitcoin reversal?
In contrast, NekoZ identified Bitcoin moving within a broad parallel channel that has been going on since August. The analyst noted that the BTC-USD pair recently rebounded from the lows around $108,000 that caused repeated reversals last month.
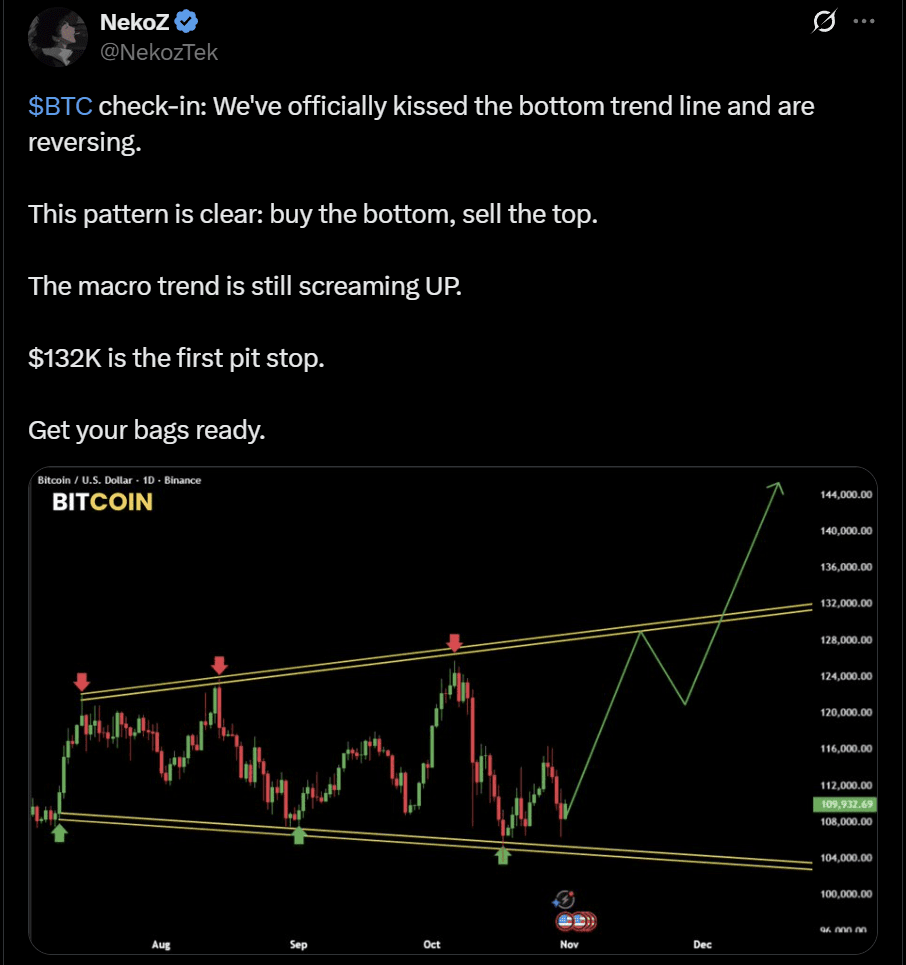
NeoZ’s chart suggests that if momentum expands, the market could turn higher with the first major resistance level at $132,000. This structure implies an accumulation phase in the lower band of the range. This was supported by rising lows formed in the intraday timeframe.
Ted Pillows added a liquidity-based view and observed that Bitcoin price regained support at $107,000 after a temporary decline.
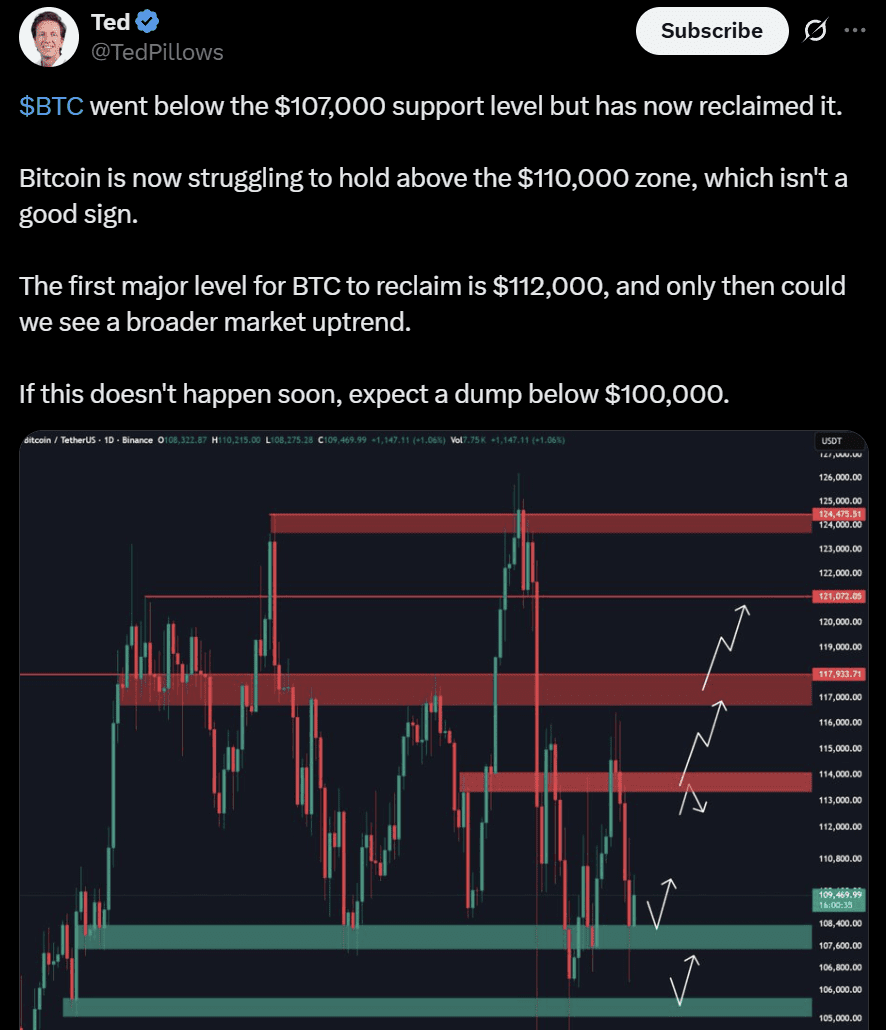
Additionally, Pillows marked $112,000 as a significant short-term recovery that could support a broader reversal structure. He warned that below that level, Bitcoin risks falling further below $105,000 before stabilizing.
Above all, the overlapping analysis reinforced a simple message. The correction phase is technical rather than emotional, and the direction of the next breakout will depend on how Bitcoin behaves around the immediate liquidity pivot.