
Bitcoin recently formed a classic double-dip pattern over the weekend, suggesting a potential bullish shift. The cryptocurrency ended this week above its key 50-week moving average, suggesting growing confidence among investors. While technical signals point to a continued uptrend, on-chain data and short-term market factors point to areas of caution that traders should monitor closely.
- Bitcoin’s double bottom pattern could push the price towards $110,000 if bullish momentum persists.
- The CME gap near $104,000 could lead to a short-term retracement before further upside.
- An increase in a stablecoin’s reserves indicates an accumulation of off-chain liquidity, which could fuel future upside attempts.
- Increased stress among short-term holders signals short-term volatility in the crypto market.
Bitcoin (BTC) confirmed a textbook double-dip over the weekend, with its weekly close above its 50-week moving average, a key bullish indicator. This pattern is consistent with previous support areas, particularly the daily order block between $98,100 and $102,000, where Bitcoin repeatedly tested the $100,000 mark before rising.
After a bullish breakout of the structure on the 4-hour time frame, Bitcoin is currently facing resistance near the $111,300 level. If this momentum continues, this level could be tested. However, on-chain analysis suggests there may be hurdles to the rally. According to Glassnode, BTC has recently recovered from around $100,000 on a 75th percentile cost basis. The next important resistance level is located near the 85th percentile, around $108,500. This represents the average price at which most investors purchased their holdings, so it is a barrier that has historically tested recovery moves.
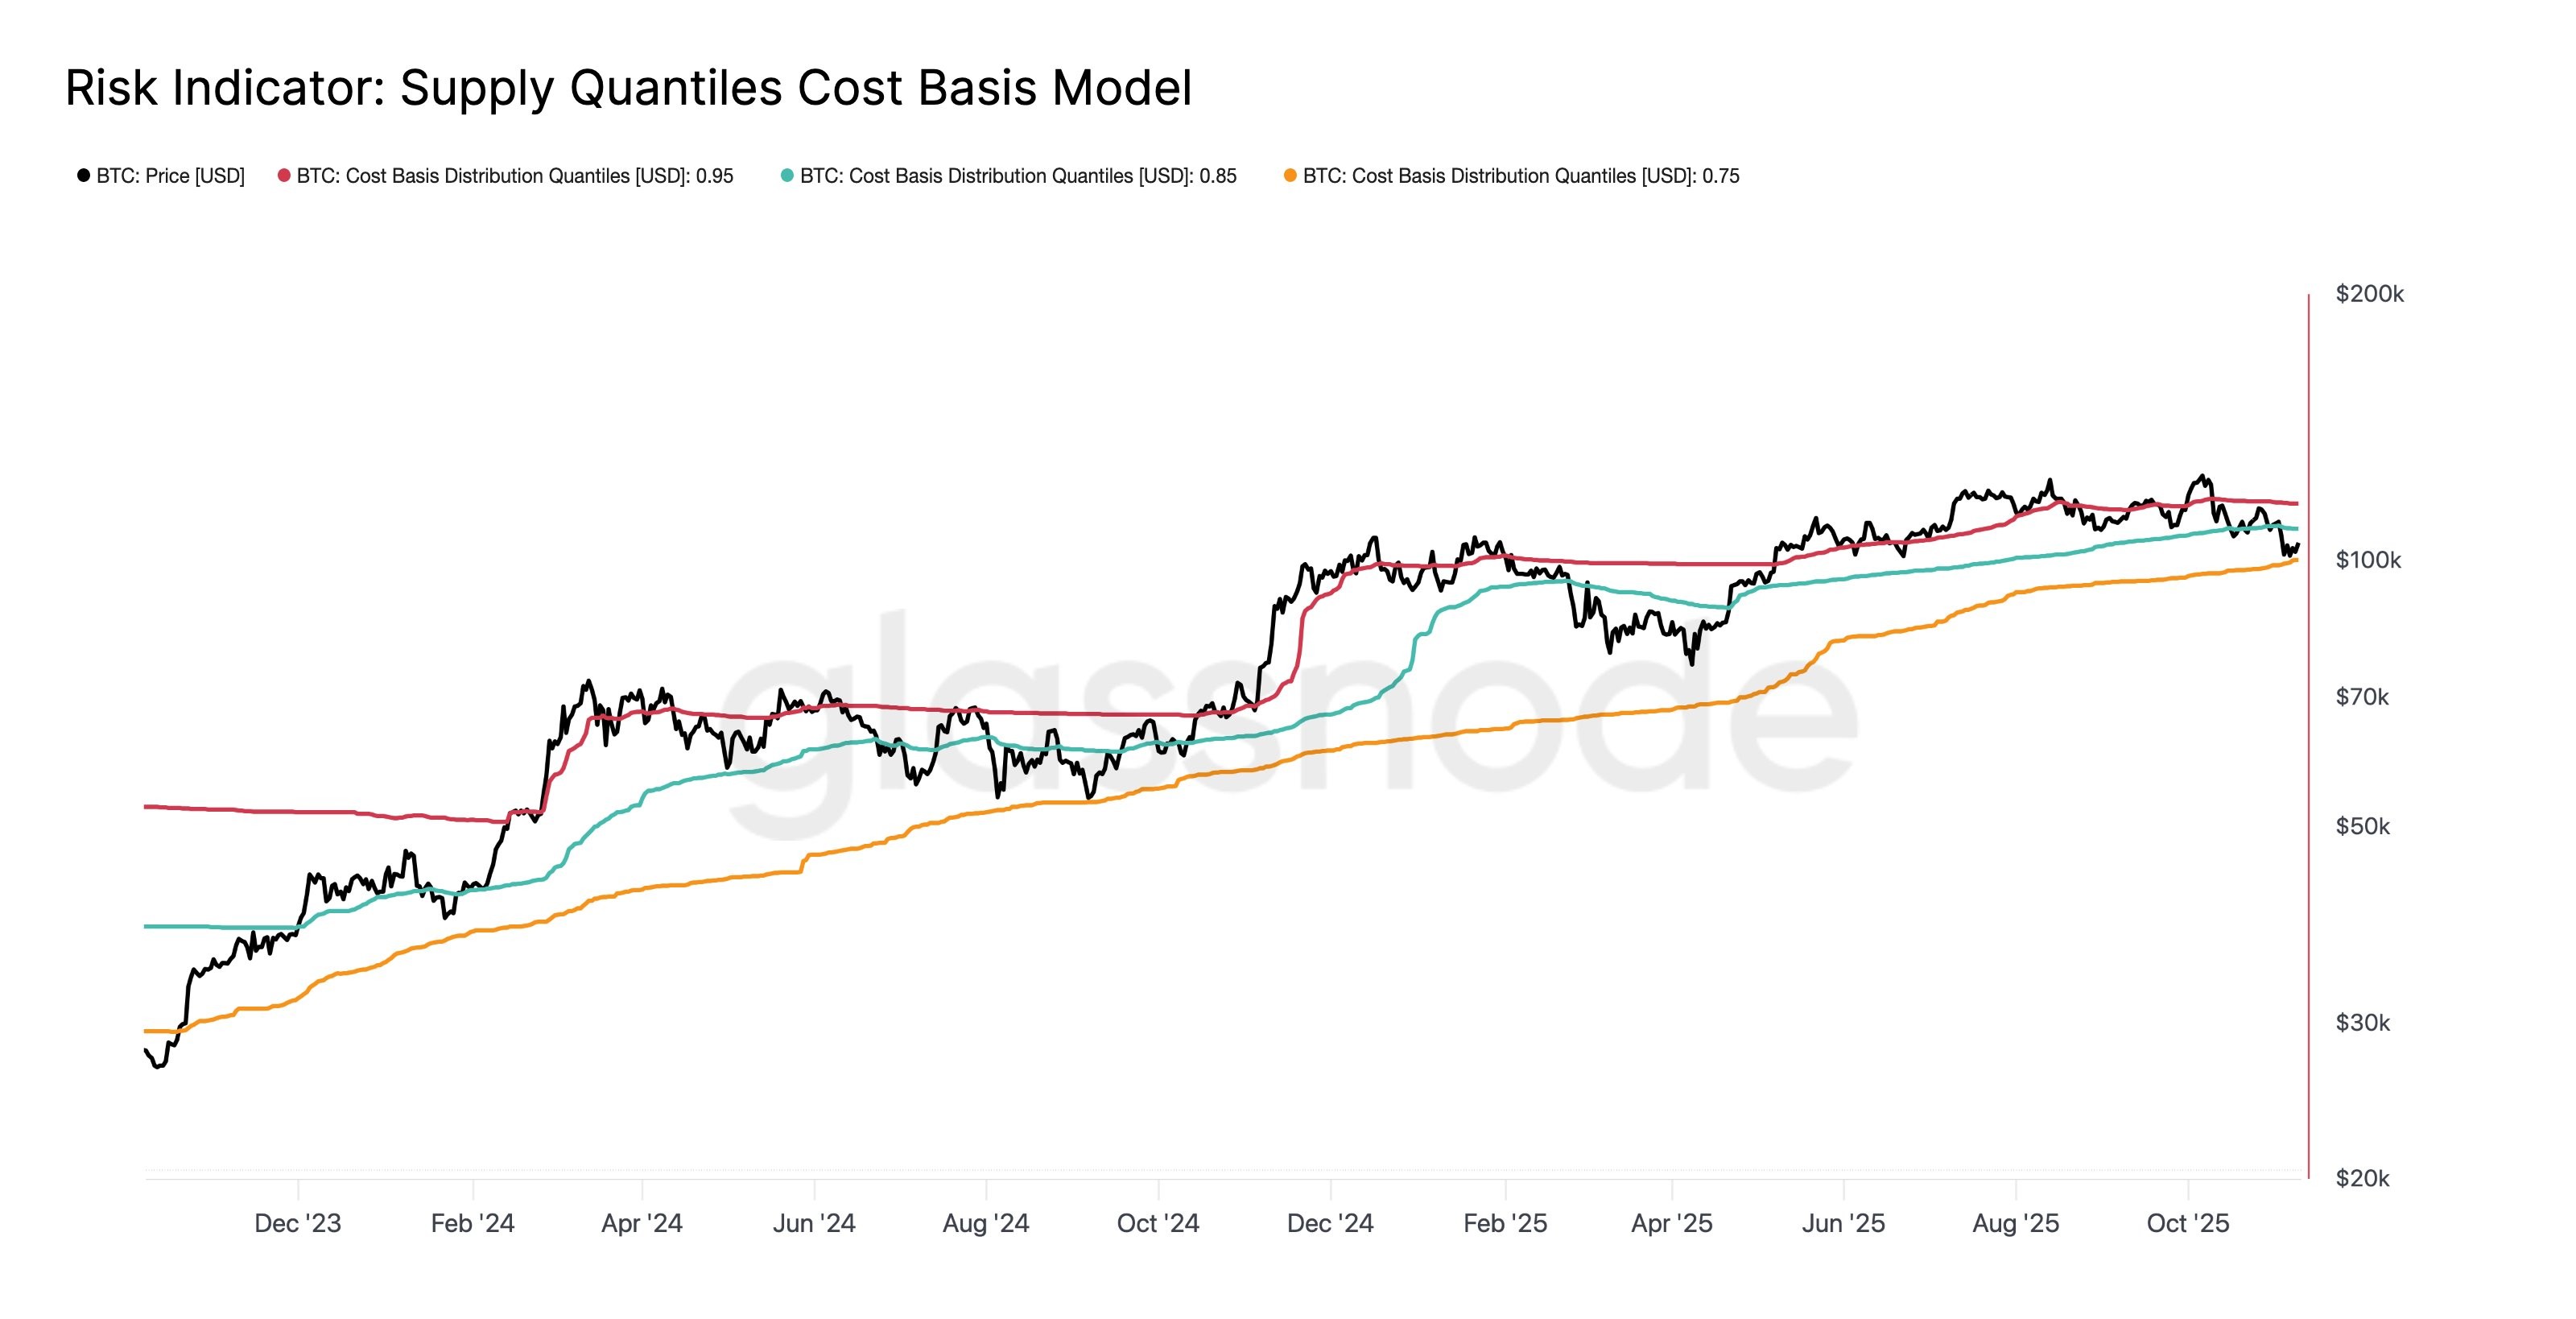
Nevertheless, as indicated by the potential accumulation of liquidity, the major resistance level is looming near the $115,000 level, which corresponds to the daily resistance level. Additionally, there is a notable gap in CME futures between $103,100 and $104,000. Such gaps often act as magnets for traders to revisit these levels, potentially leading to a short-term retracement before Bitcoin returns to its upward trajectory.
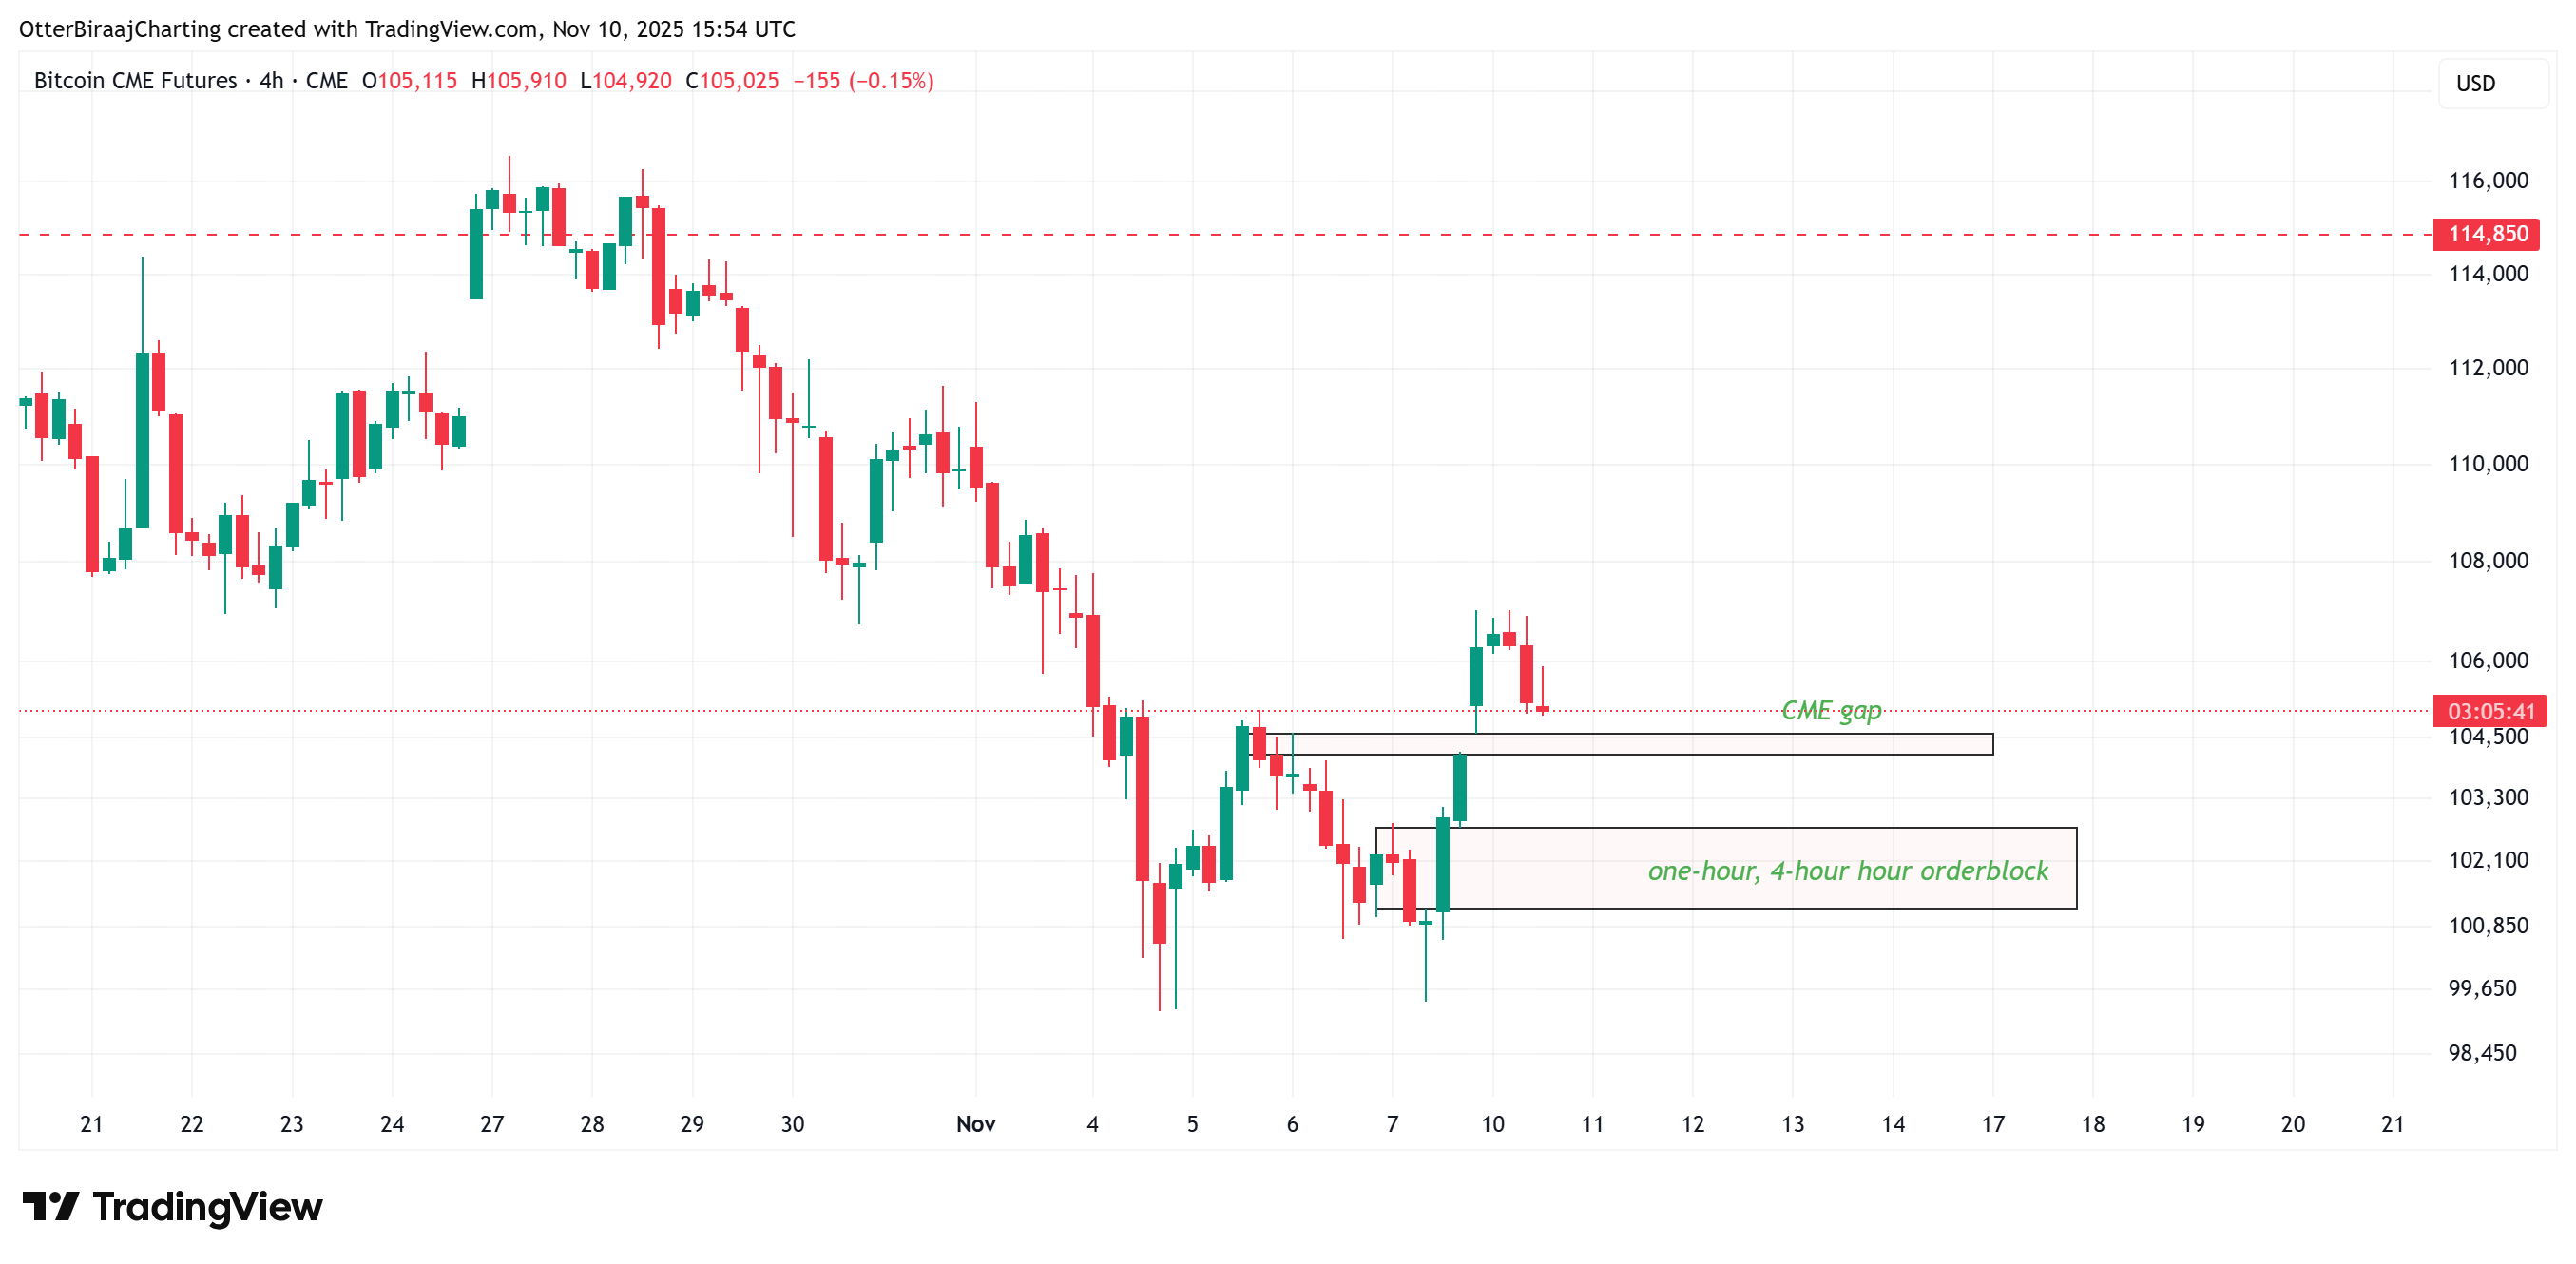
With market liquidity tightening and buy-side participation waning, BTC could fall and revisit levels between $101,000 and $102,500, thereby testing recent order blocks before resuming a bullish rally.
Stablecoin reserves and short-term holder behavior impact market outlook
According to CryptoQuant data, the stablecoin supply ratio (SSR) has fallen from over 18 at the beginning of this year to just 13.1, one of its lowest levels in 2025, indicating an increasing accumulation of off-chain liquidity. This suggests that investors are quietly accumulating stablecoins, waiting for clearer market signals before putting money into crypto assets.
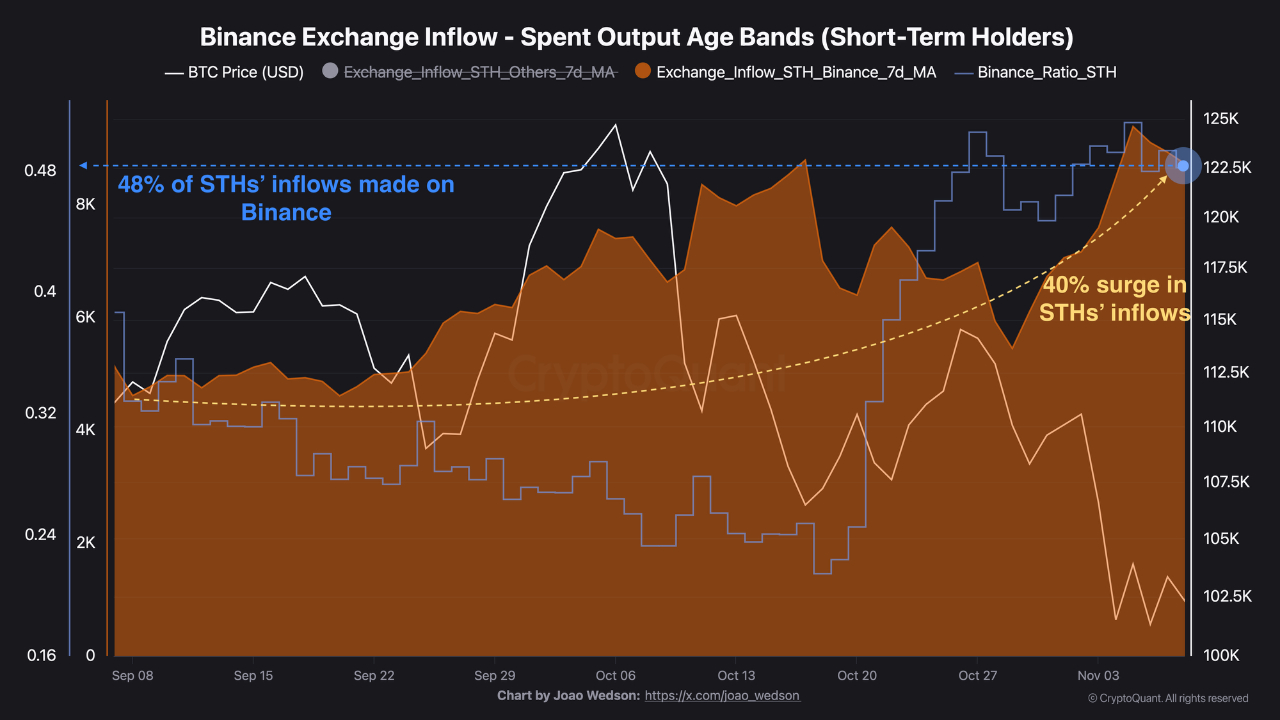
Meanwhile, crypto analyst Dirkforst highlighted that short-term holders (STH) inflows to Binance have surged by 40% since September, from 5,000 BTC to 8,700 BTC. The average purchase price for STH is nearly $112,000, and many of these investors are currently underwater. These short-term investors tend to act defensively in volatile environments, and their increased selling pressure could add short-term uncertainty to Bitcoin’s outlook ahead of further price correction.
Overall, technical indicators predict a likely continuation of the bullish trend in the cryptocurrency market, but traders should remain cautious amid on-chain resistance and short-term profit-taking signals. As the market grapples with these subtle signals, the coming weeks are likely to bring further volatility and strategic opportunities for investors tracking the evolving cryptocurrency landscape.