

FET price USD showed a strong recovery in November, breaking out of the local swing pattern failure zone and regaining the 34-EMA for the first time since September. FET prices are consolidating below significant resistance today, and traders are now focused on whether the asset can clear the key Fibonacci zone and move into a meaningful bullish structure.
Strong rebound in early November, but significant resistance is expected in the future
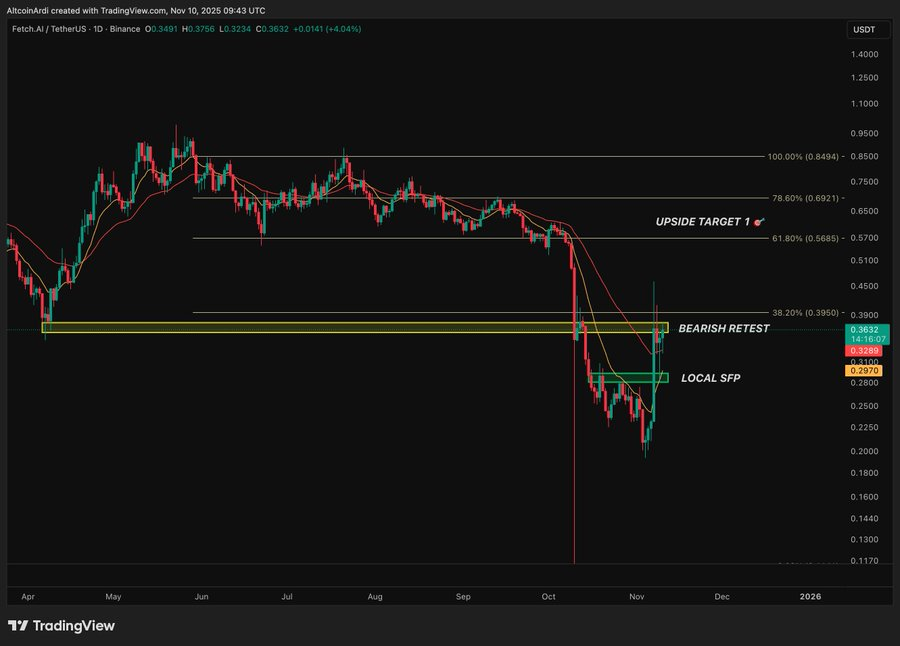
According to a recent post on “amebocrypto” on CoinMarketCap, the recent breakout from the local swing pattern failure zone has pushed the FET price chart into bearish retest territory around the 38.2% Fibonacci level, around $0.395. This explosive upward move was quickly rejected, suggesting that supply pressure had become heavy and overextended into a pocket of resistance.
Despite the resistance, FET/USD still managed to reclaim the 34-EMA on the daily time frame, a level not held since September. This recovery signals structural improvement but needs to be confirmed through a sustained close above the $0.395-$0.41 resistance cluster.
If buyers fail to reclaim this zone, the FET cryptocurrency could revisit structural support near $0.293 and even $0.26, the level that has previously summed up the overall trend.
A bullish recovery above $0.41 could trigger a strong trend shift
Amebocrypto further explains that a clean breakout and a decent close above $0.41 on FET/USD could likely invalidate the bearish retest and even pave the way for an upside target 1 near $0.568. This level is considered the next major barrier that price needs to overcome before a larger bullish structure forms.
A return to $0.568 would change market sentiment dramatically and align with the corrected weekly falling wedge pattern that has been forming since the 2024 decline. Based on current momentum and assuming market conditions remain favorable, a wedge breakout could push the 2025 FET price forecast towards $1.0-1.10 by the end of the year.
Such movements reflect the technical potential seen on higher time frames, where compression phases often lead to explosive expansion when resistance is reversed.
Weekly descending wedge setup suggests bigger rally in 2026
The broader outlook shows that the adjusted weekly downward wedge pattern remains in place, suggesting that FET is nearing the top of a long consolidation structure. If the coin gains momentum and breaks above $1.10, it could be a significant rally in the first half of 2026.
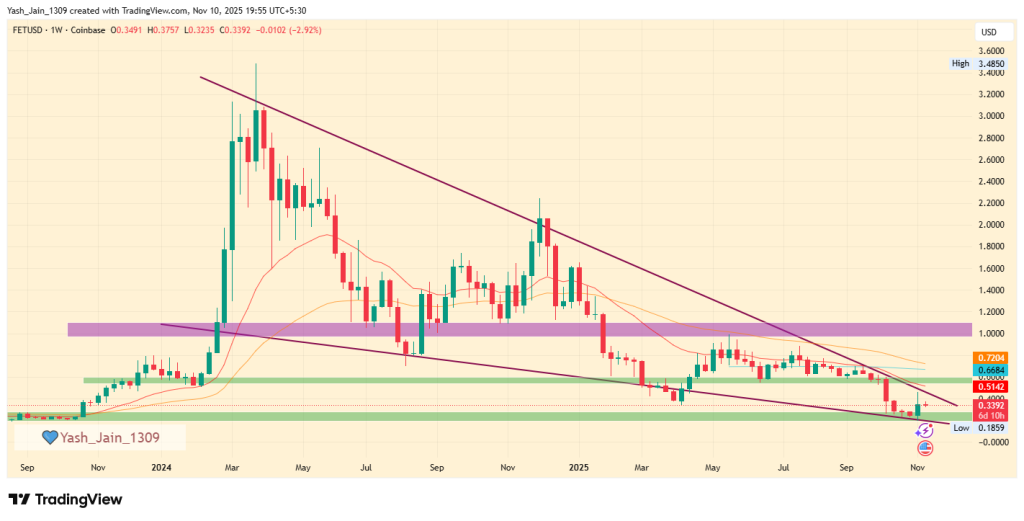
If the wedge breakout persists, the forecast outlook for FET prices suggests that the market could attempt to revisit the all-time high of $3.48 in the first half of 2026. This scenario relies heavily on a confirmed breakout above $0.568 followed by a 2025 close above $1.00 based on weekly FET price chart observations.
As November progresses, the USD outlook for FET prices sits at a key pivot point between continued consolidation and the possibility of a multi-month trend reversal.
Trust CoinPedia:
CoinPedia has been providing accurate and timely cryptocurrency and blockchain updates since 2017. All content is created by an expert panel of analysts and journalists following strict editorial guidelines based on EEAT (Experience, Expertise, Authority, and Trustworthiness). All articles are fact-checked against trusted sources to ensure accuracy, transparency, and authenticity. Our review policy ensures unbiased evaluations when recommending exchanges, platforms, or tools. We strive to provide timely and up-to-date information on everything cryptocurrencies and blockchain, from startups to industry giants.
Investment Disclaimer:
All opinions and insights shared represent the author’s own views on current market conditions. Please do your own research before making any investment decisions. Neither the author nor the publication is responsible for your financial choices.
Sponsors and advertising:
Sponsored content and affiliate links may appear on our site. Ads are clearly marked and our editorial content is completely independent of our advertising partners.