
Please join us telegram Channels where you can get the latest information on breaking news
Bitcoin prices fell 4% in October, breaking a seven-year “uptober” streak as ETF outflows, profit-taking and macro concerns weighed on the market.
This was Bitcoin’s fourth worst October performance since 2013 and the worst in seven years, according to Fortune analysis. As a result, BTC lagged behind the S&P 500 stock index, which rose 2.3%.
The selloff was triggered by the outflow of more than $550 million from major Bitcoin and Ethereum ETFs late that month, but analysts said profit-taking also played a role, with Bitcoin treasury firms such as Michael Saylor Strategy also delaying Bitcoin purchases.
I experienced Red October for the first time in 7 years!
In October, we also carried out a historic liquidation.
UPTOBER was a scam but MOONVEMBER??
IMHO;
If possible, please do more DCA!
If you can’t do that, don’t panic and sell your bag cheap.
If you are short on $$ and are sure of the port… pic.twitter.com/LH7aYTwQeY
— Blockchain Bob (@blockchainbob) October 31, 2025
Even the one-year trade truce agreed to last week by US President Donald Trump and China’s Xi Jinping wasn’t enough to send Bitcoin rallying again this month.
President Trump’s announcement on October 10th to impose 100% tariffs on Chinese exports led to more than $19 billion in liquidations in 24 hours, the largest ever in the cryptocurrency market.
One of the reasons that sentiment remained subdued even after the US-China trade ceasefire was that Federal Reserve Chairman Jerome Powell made comments this week that further rate cuts in December were not a certainty.
$BTC Silence is a signal
The fluctuations in price are small and the fluctuations in confidence are large.
Exchange supply reaches cycle lows while long-term holders quietly tighten their grip on liquidity.
ETFs continue to absorb without headlines, increased mining difficulty, or compressed volatility.
This is different… pic.twitter.com/7ylx3uoCW7
— Senior 🛡🦇🔊 (@SeniorDeFi) October 31, 2025
Bitcoin’s on-chain signals show resilience
Despite the decline in coin prices, on-chain data shows the continued strength of the Bitcoin network. exchange reserves Bitcoin’s value hit an all-time low in October, dropping more than 200,000 BTC in just one month. This means fewer coins are being held on exchanges where they can be easily sold.
A sign that investors are moving coins into wallets and may be planning to hold them for the long term.
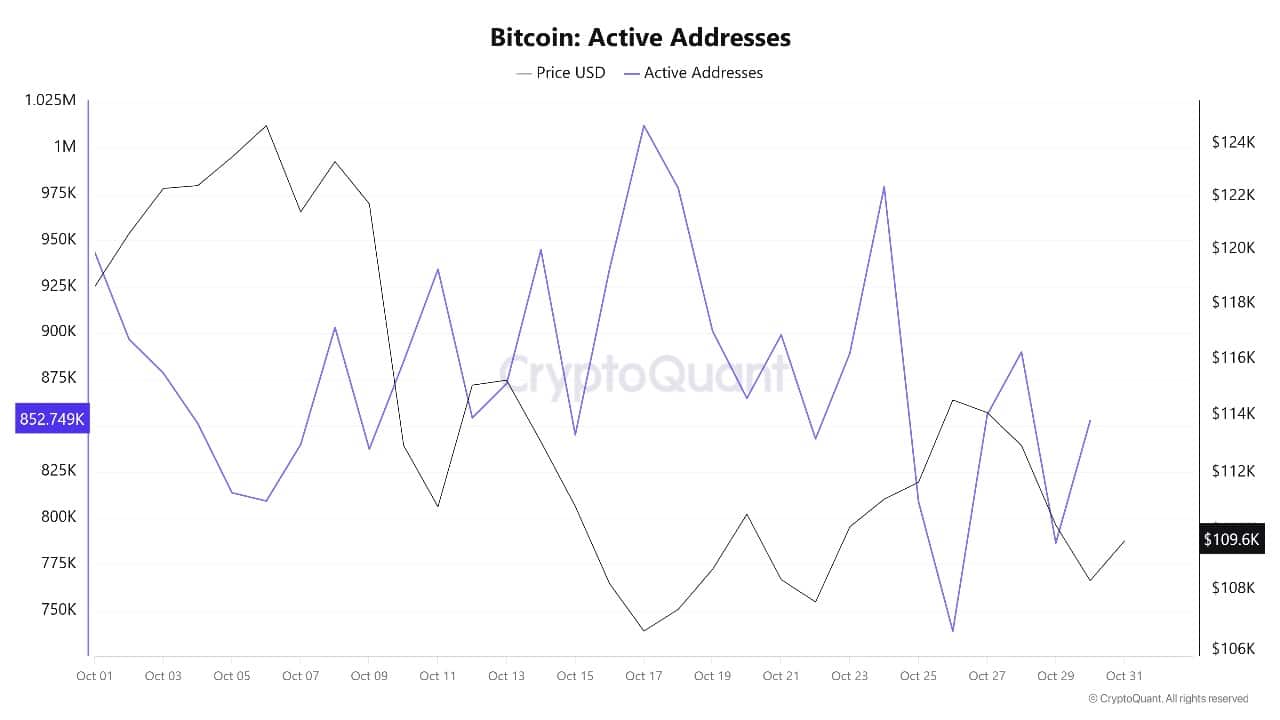
The supply of BTC on trading platforms is decreasing, increasing the coin’s scarcity and potentially setting the stage for a future bull market. This withdrawal pattern is similar to what happened before Bitcoin’s big rally in 2020 and reflects a strong belief in Bitcoin’s long-term value.
Despite the ETF outflow, institutional accumulation is still occurring as some large companies are transferring their coins to private vaults. Bitcoin network activity (including active) address and transaction The numbers have remained strong, showing that people are using the network even during a month when prices have fallen.
Bitcoin price prediction
Looking at the weekly price chart, Bitcoin is currently trading at . $109,496.77which has fallen back from October’s highs but remains well above key support levels. The price is above its 50-week simple moving average (SMA) of $102,843.54, but the longer-term 200-week SMA is much lower at $54,756.36.
These SMA levels act as strong support for Bitcoin price and help limit further losses. The chart shows that Bitcoin remains within an uptrend channel, with resistance near $125,761 and support near $102,843. The uptrend will continue as long as the price remains above the lower support line and the major moving average.
Technical indicators indicate a pause in bullish momentum. The Relative Strength Index (RSI) is at the midpoint of 50.32, suggesting that neither buyers nor sellers are clearly in control, and the market is consolidating.
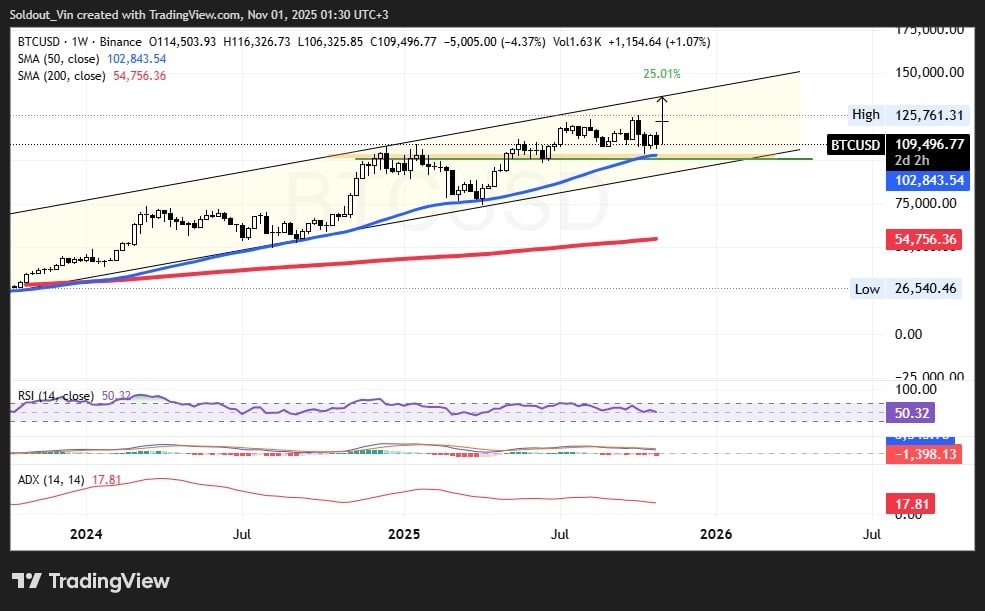
BTCUSD analysis source: Tradingview
The average directional index (ADX) is 17.81, indicating that the current trend is weak and new momentum is needed to initiate further upside. If buyers return and break through the resistance at $125,761, Bitcoin could attempt to regain its highs. However, if the price breaks below the 50-week SMA ($102,843), further selling could push it towards the next major support at $54,756.
The MACD (moving average convergence divergence) indicator remains in neutral territory, suggesting a sideways movement for now. Due to low volume and lack of momentum, Bitcoin is likely to trade in a tight range for the next few weeks.
If the coin’s price rebounds from the support at $102,843, a new attempt at the resistance at $125,761 could attract more buyers. However, a break below support could cause Bitcoin to test deeper levels before the bulls intervene again.
November will largely depend on global financial trends and whether new institutional money returns to the market. Once macro risks subside and ETF flows become positive again, the coin price could resume its rally and head further upwards.
However, the price is likely to stabilize as bulls and bears wait for the next big move. Traders should keep an eye on the support at $102,843 and resistance at $125,761. A break above these levels could indicate the next direction for Bitcoin price.
Related articles:
Best Wallets – Diversify your crypto portfolio

- Easy-to-use, feature-oriented crypto wallet
- Get early access to upcoming token ICOs
- Multi-chain, multi-wallet, non-custodial
- Now available on App Store and Google Play
- Stake and Earn Native Tokens $BEST
- 250,000+ monthly active users
Please join us telegram Channels where you can get the latest information on breaking news