
Bitcoin (BTC) fell below the $110,000 level in a sharp move that spooked the market and triggered a wave of short-term panic selling. The sudden drop followed the first post-Fed volatility spike as traders reacted to the US Federal Reserve’s announcement of a 25bps interest rate cut and an imminent end to quantitative tightening. With uncertainty still lingering, BTC briefly entered a risk-off spiral, testing investor confidence and washing out leveraged positions in the process.
Related books
Despite the market turmoil, several analysts argue that the move may represent a classic shakeout rather than the beginning of a larger collapse. Historically, Bitcoin has often seen sharp declines just before new upward momentum emerges, especially during early liquidity expansion stages.
For now, all eyes are on whether Bitcoin can stabilize and regain the $110,000 zone that it has pivoted to numerous times over the past month. As the market digests the Fed’s decision, the focus shifts to whether Bitcoin can wake up from this sudden drop and regain strength heading into November.
PoC becomes a key battleground as markets signal indecision
According to top analyst Onchain Mind, Bitcoin’s current price structure is defined by a major volume cluster centered around $117,000, which currently serves as a point of control (PoC) for the local market profile.
This level represents the most heavily traded price zone in the recent range. Effectively, this is the point where buyers and sellers have shown the most interest and where the market has spent considerable time rebalancing liquidity.
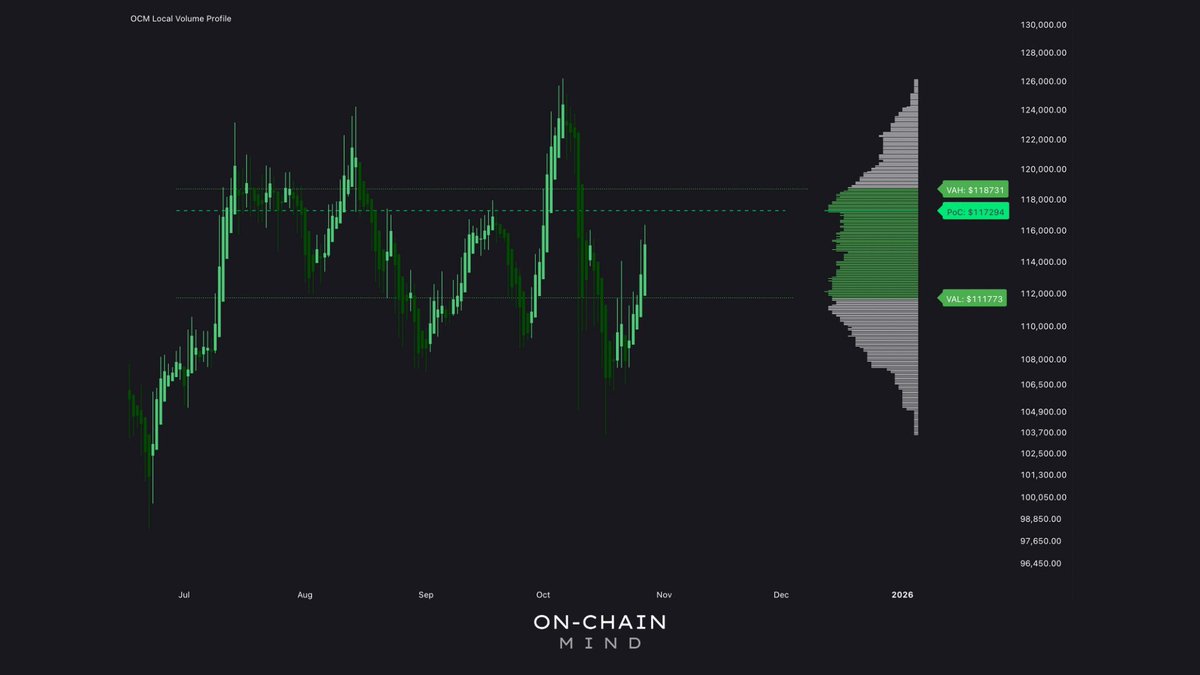
In reality, the PoC acts as a fair value zone for market participants. If the price is trading below that, bulls need to regain that level to regain trend strength. The zone tends to act as support if the price trades above it. BTC is currently below its PoC of $117,000, indicating that the market has yet to reestablish bullish dominance after the recent shakeout.
On-chain Mind points out that regaining $117,000 is likely to spark fresh momentum and open the door for a retest in the $120,000 to $123,000 range. But until then, the structure remains indecisive, with prices hovering in a neutral zone with neither bulls nor bears having a clear advantage. This is consistent with broader market movements, including reduced leverage, mixed sentiment and trader caution following aggressive liquidations in early October.
The market is digesting macro shifts, readjusting position sizes, and waiting for clearer signals. If Bitcoin is able to stabilize above recent support and start moving back toward PoC, a return to $117,000 could mark the moment the next leg up begins.
Related books
Bitcoin tries to recover above $110,000
Bitcoin (BTC) is currently trading around $110,180 on a 4-hour period and is looking to stabilize after yesterday’s sharp drop. Prices managed to regain the $110,000 level, suggesting buyers have stepped into intraday lows around $108,500, a key local demand zone that has repeatedly supported prices since mid-October. However, the recovery remains fragile and BTC is currently approaching a cluster of short-term resistance levels.

The 50-period EMA is currently slightly above the price, and the 100- and 200-period moving averages are still overhead, indicating a bearish trend. This alignment shows that momentum has not yet fully returned to the bullish side.
To regain control, BTC needs to break above $112,000-113,000, where multiple moving averages converge and the previous support acts as resistance. A clearing of this zone would pave the way for the key control point at $117,500 – a key level that the bulls need to regain to reestablish medium-term strength.
Related books
If Bitcoin fails to hold $110,000, support lies at $108,500, followed by a deeper liquidity zone around $106,000, with buyers strongly defending the price during the October 10 flash. For now, BTC remains in a neutral recovery position, looking to build on its foundation while weathering macro uncertainties and overhead pressures from recent deleveraging.
Featured image from ChatGPT, chart from TradingView.com